Growing by multiplying
Fold a sheet of paper in half and it is two layers thick. Fold it again: four. Again: eight. Each fold does the same thing, it multiplies the thickness by 2, yet the stack grows faster and faster. Ten folds would make 1,024 layers. Growth like this, where a quantity is multiplied by the same factor at every step, is called exponential growth, because after n steps the size is the factor raised to the power n: 2¹⁰ for ten doublings.
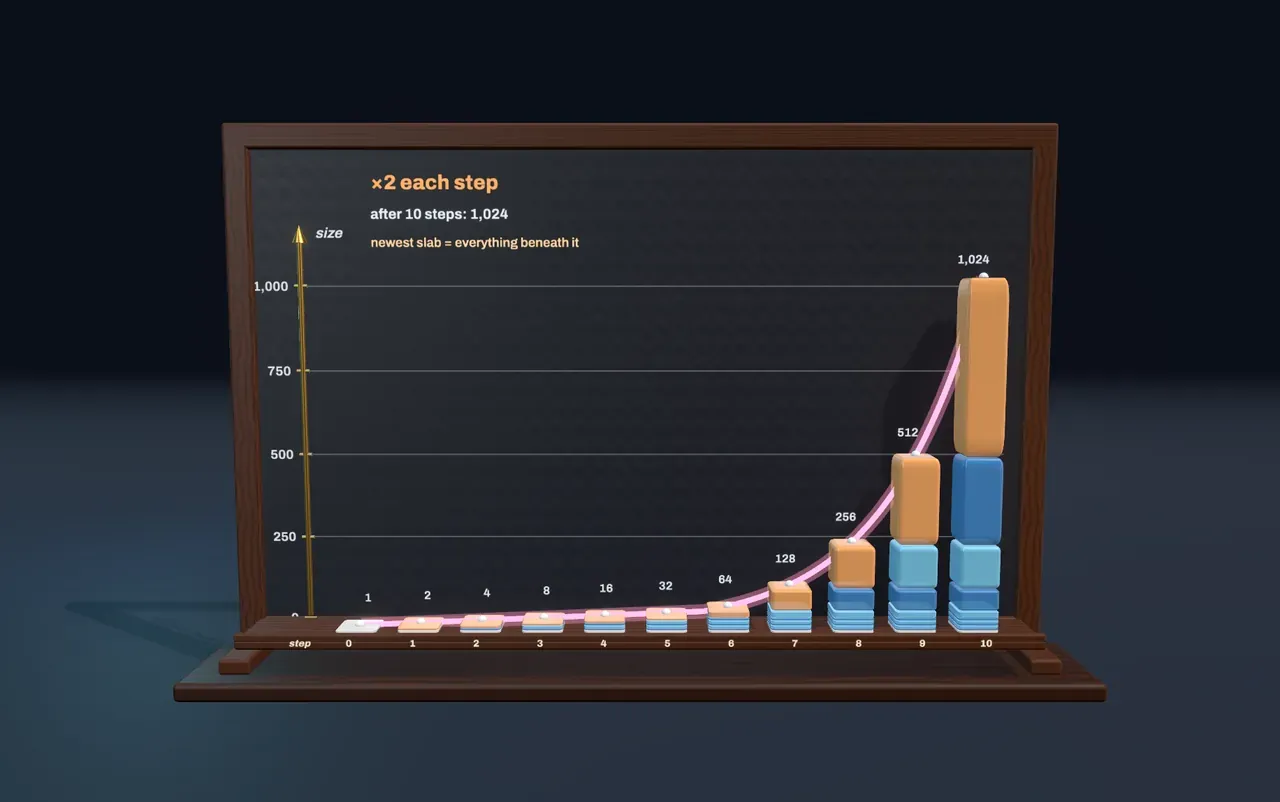
The board shows it as a row of columns standing on the ledge. Column 0 is the starting amount, 1. Each column to the right is one step later and is built from the column before it plus one new slab, the growth added in that step. The newest slab in every column is amber.
Each doubling outweighs all the past
On the ordinary scale, height is proportional to size. With doubling, look at the amber slab on top of any column: it is exactly as tall as everything beneath it. That is what doubling means. If you have 512 and double, the step adds another 512, as much as all the previous steps put together.
So for a long time almost nothing seems to happen. After five doublings the stack is only 32, a sliver next to the 1,024 it reaches five steps later. Most of the growth always lies in the last few steps, which is why exponential growth catches people out: halfway through the time, the stack is nowhere near halfway in size.
The same is true for any growth factor, just with a different share. At ×3 each step adds twice the stack beneath it; at ×1.5 it adds half. Even at ×1.1, a steady 10% per step, the additions keep getting bigger, and the curve through the column tops bends upward.
Logarithms count the multiplications
A logarithm answers the reverse question: how many times must you multiply? The base-10 logarithm of 1,000 is 3, because 10 × 10 × 10 = 1,000. The base-10 logarithm of 2 is about 0.301: ten doublings make 1,024, very nearly three factors of ten, so one doubling is worth about three tenths of one.
John Napier published the first tables of logarithms in 1614, and Henry Briggs soon reworked them into base 10. Their appeal was practical. Logarithms turn multiplication into addition, since the logarithm of a product is the sum of the logarithms, so astronomers and navigators could multiply long numbers by adding entries from a table.
Why a log scale makes a straight line
A log scale spaces numbers by their logarithms instead of their size. On it, 1, 10, 100 and 1,000 are evenly spaced, because each is ten times the last. Any two numbers with the same ratio are the same distance apart.
Try it: slide Growth per step to ×2, doubling, then choose Log scale under Switch to a log scale. Every slab becomes the same height and the pink curve straightens into a line. Then slide Growth per step to ×3, and to ×1.1, and watch the line tilt.
Each step multiplies by the same factor, so on a log scale each step climbs by the same height: the logarithm of the growth factor. Steady multiplication becomes a straight line, and the steepness of that line is the logarithm of the growth factor. At ×2 each step climbs 0.301 of a power of ten; at ×3, 0.477; at ×1.1, only 0.041. Reading a growth rate off a log chart is just measuring a slope.
This is why scientists plot growth on log scales. A straight stretch means steady exponential growth, a line that bends over means growth is slowing, and a much steeper line means the multiplying factor went up.
Where log scales turn up
Many everyday measurements are logarithmic because the things they measure span huge ranges. On the decibel scale for sound, each 10 decibels means ten times the sound intensity. Each step down the pH scale means ten times as many hydrogen ions, so lemon juice at about pH 2 has around a hundred thousand times as many as pure water at pH 7. Each whole number up the earthquake magnitude scale releases about 32 times as much energy. A slide rule multiplies by sliding two log scales along each other, adding lengths to multiply numbers.
What this model leaves out
Real growth never goes on multiplying forever: bacteria run out of food, savings meet withdrawals, epidemics run out of people to infect, and the curve flattens. The board grows in whole steps; growth that compounds continuously is described with the number e and natural logarithms instead.
Both scales are fitted so the tallest column reaches the top. A log scale has no zero, so the board puts 1 just above the ledge and gives the starting slab a small fixed thickness there. On the ordinary scale, no slab is drawn thinner than a minimum, so the first few columns of fast growth stand a little taller than their true size; the numbers printed above them are exact, rounded to three figures.