One ball, no idea
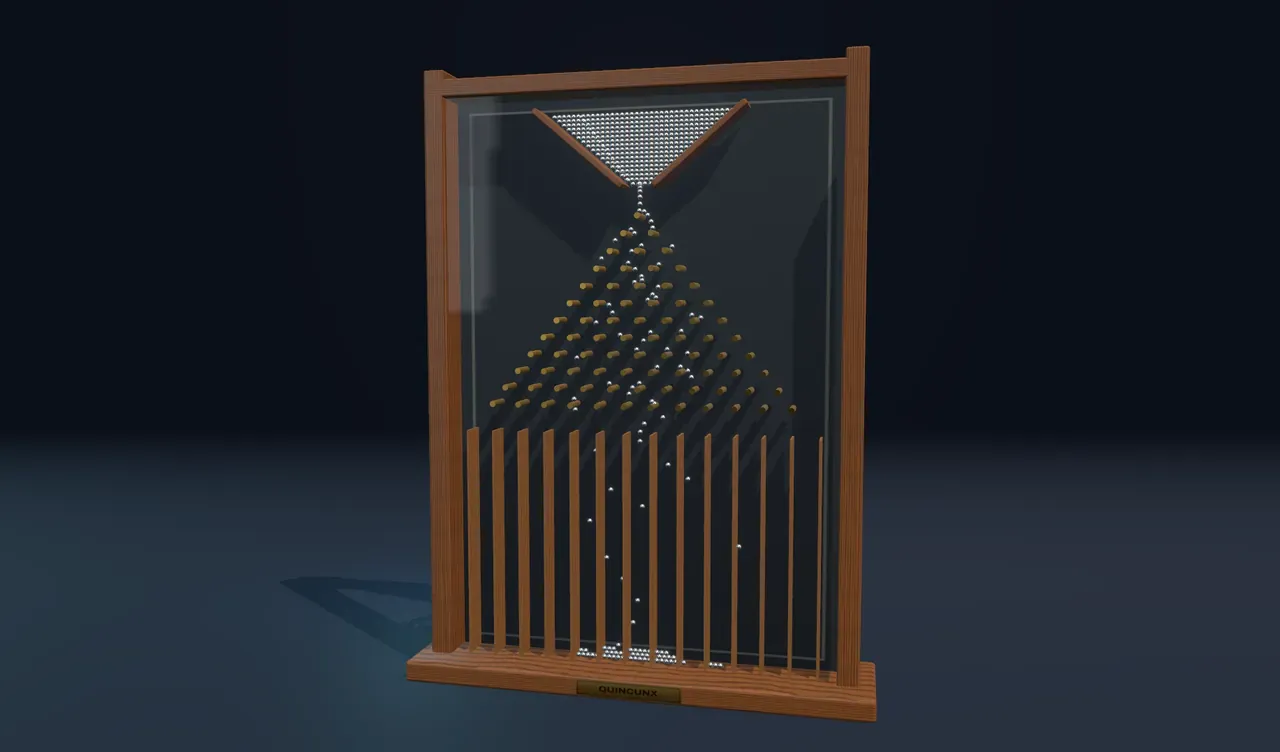
Drop a single ball into the board. At the first peg it bounces left or right, and nothing you can see decides which. At the next peg it chooses again, and again at every row, so where it lands is anyone’s guess. Yet keep pouring and a shape appears: a tall pile in the middle that falls away on both sides. Run the board again and the same shape returns, though every ball went somewhere new.
The device is a Galton board, named after Francis Galton, who built one in the 1870s to show how chance produces regular patterns. He called it a quincunx, after the five-dot pattern its pegs repeat.
Counting the paths
The middle wins because more paths lead there. A ball that bounces right k times and left the rest lands in bin k, whatever order the bounces came in. With twelve rows there is exactly one path to the far left bin, all lefts, and one to the far right. There are 924 different paths to the middle bin. Out of 4,096 equally likely paths, that makes the middle 924 times as likely as either edge.
Those counts are the numbers in Pascal’s triangle, and the pattern they make is the binomial distribution: the chance of k successes in n tries when each try succeeds with the same probability.
Try it: set Rows of pegs to 4 and watch only five bins fill, in rough proportion 1 : 4 : 6 : 4 : 1. Then slide it up to 16, and set Chance of bouncing right to 75 % to make every peg favour the right.
The bell appears
With more rows the staircase of bars smooths into a curve, the normal distribution, the famous bell. Abraham de Moivre showed in 1733 that the binomial approaches this curve as the number of tries grows. Choose On under Show the bell curve to see it, drawn for the number of balls landed so far.
Leaning the pegs moves the hump but barely changes its shape. Its centre sits at rows × chance, and its spread is the square root of rows × chance × (1 − chance). A fair twelve-row board has a spread of about 1.7 bins, and about six balls in ten land in the middle three bins.
Why the world is full of bells
The bell turns up far beyond pegboards. Whenever a result is the sum of many small, independent nudges, it tends towards this curve, whatever the nudges are like on their own. That is the central limit theorem, and it is why measuring errors and the total of many dice come out bell-shaped.
A second rule is at work as the pile grows. Early on the bars are ragged and stray from the curve; after hundreds of balls they hug it. The fraction landing in each bin settles towards its true probability as the tries pile up: the law of large numbers, proved by Jacob Bernoulli and published in 1713. Chance does not even out; a run of lefts is never cancelled, only swamped by everything that follows.
What this model leaves out
Real balls are not perfect coin tosses. They spin, carry sideways speed from one peg to the next and knock into each other, so a real board’s pile can differ from the binomial prediction. Here every bounce is an independent choice with exactly the chance you set, and the hops between pegs are drawn for clarity rather than computed. The balls are sized so the tallest likely pile fits under the pegs. The bell curve only approximates the binomial: closely with many rows, roughly with few.