Two pendulums, one start
Hang a second rod from the end of a pendulum and you have a double pendulum. Lift it and let go, and it does not settle into a steady swing. The lower rod whips round, stalls, flips over the top and falls back in a pattern that never quite repeats.
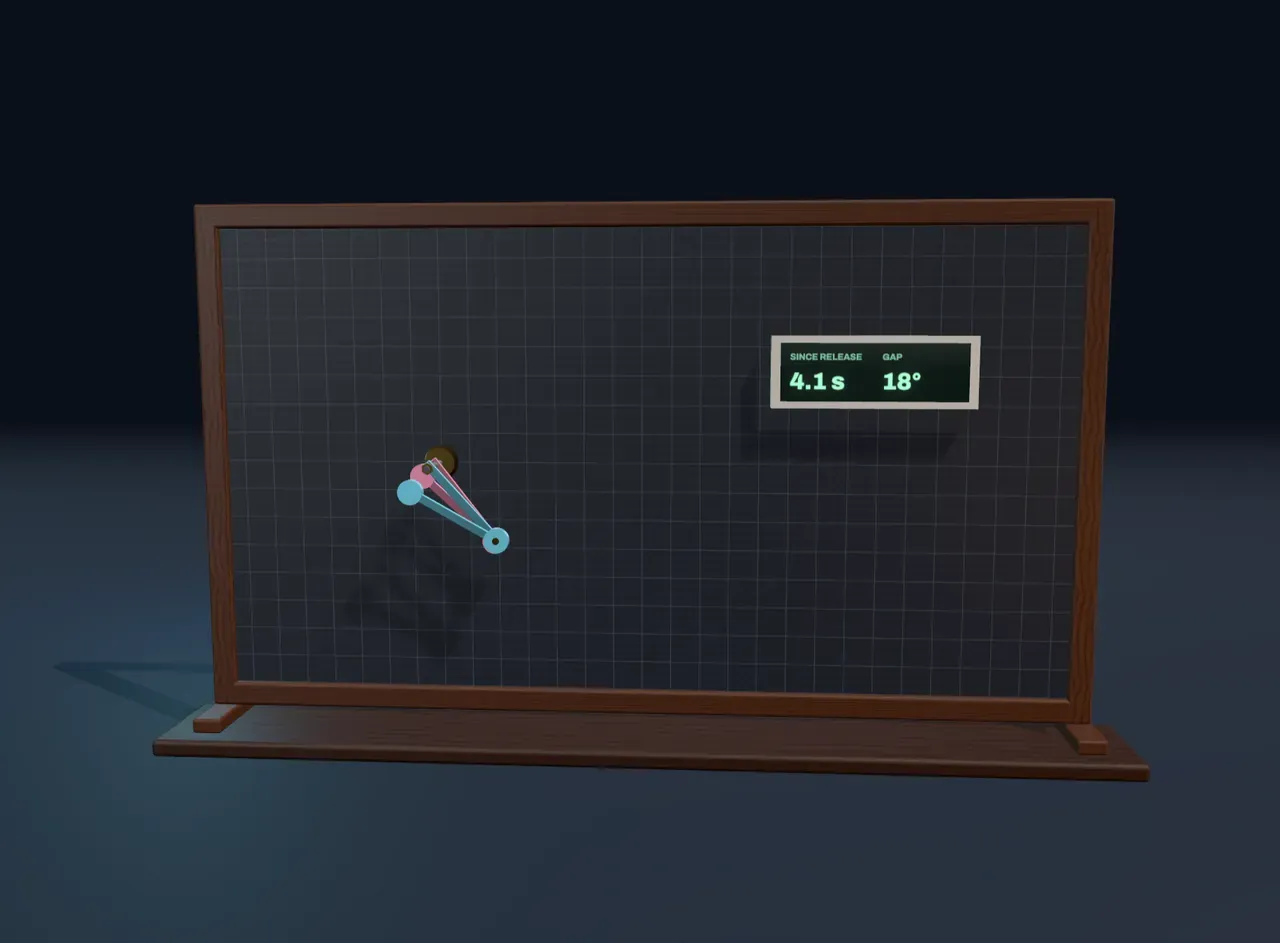
The scene holds two of them, built exactly alike and hung on the same axle, a blue one in front of a pink one. Both are released from the same height at the same moment. The only difference is that the pink one starts a tiny fraction of a degree further round. For the first few seconds the two move as one; you can hardly see the pink one behind the blue. Then, quite suddenly, they part and go their own ways.
Small causes, large effects
Nothing random happens in the scene. Each pendulum follows the same laws of motion, worked out step by step from where it is and how fast it is moving. Release the pair with exactly the same angle and they stay together forever, in step to the last decimal place. Motion that is completely fixed by its starting point is called deterministic.
Yet a deterministic system can still be impossible to predict. A tiny difference in the start does not stay tiny. In the double pendulum it roughly doubles again and again, at a steady rate, until it is as large as the swing itself. This extreme sensitivity to the starting point is what mathematicians mean by chaos.
Try it: slide Release angle up to 135°, then step Difference in start angle from 1° down to 0.001°. Choose On under Show the paths and watch when the two trails part.
Making the start ten times more precise does not buy ten times more warning. Released at 120°, a difference of 0.01° grows past 10° in about four seconds; a difference of 0.001°, ten times smaller, takes only just over a second longer. Every extra decimal place of precision buys the same small amount of extra time.
Reading the chart
Choose On under Show the paths and a chart appears beside the pendulums. It plots the gap between the two against time. Its vertical scale is logarithmic: each grid square up means a gap ten times larger.
On that scale a quantity that multiplies at a steady rate climbs in a straight line. For a high release the chart rises in a ragged but straight slope, which is the signature of exponential growth. The steepness of that slope, how fast the gap multiplies on average, is the system’s Lyapunov exponent, named after the Russian mathematician Aleksandr Lyapunov. Once the gap is as big as the swing, it cannot grow any more and the line flattens out: the two pendulums are now unrelated.
Not every swing is chaotic
Release the pair low, at 30°, and the picture changes. Each pendulum rocks to and fro in a regular, repeating way, and the chart stays almost flat: the gap grows only slowly, never exploding. Many systems are chaotic in some conditions and regular in others. For this pair, released with both rods in line, the change comes at about 80°. Below it the motion is predictable; above it, a few seconds is all the warning there is.
The butterfly effect
The French mathematician Henri Poincaré found this kind of sensitivity around 1890, while studying how three bodies move under each other’s gravity. The idea became famous through the American meteorologist Edward Lorenz. In 1961 he restarted a weather simulation from numbers he had rounded to three decimal places and found that, after a while, its forecast bore no resemblance to the first run. In 1972 he gave a talk asking whether the flap of a butterfly’s wings in Brazil could set off a tornado in Texas, and the butterfly effect got its name.
The weather is chaotic in the same way as the double pendulum, only with far more moving parts. Measurements of the air are never perfect, and the errors grow until they swamp the forecast, which is one reason detailed weather forecasts lose their skill after a week or two.
What this model leaves out
The scene treats each rod as weightless and each weight as a single point, with frictionless bearings, so a pendulum keeps its energy forever. Real double pendulums slow down, and their rods have mass spread along their length, which changes the motion in detail but not its chaos. The gap on the chart combines both angles and how fast each is turning, so that it does not drop to zero every time the two pendulums happen to pass each other. Finally, the computer works with a finite number of decimal places too; the scene is honest about that by repeating each run exactly, but over long times even a computed pendulum drifts from the true one.