A glow you can read
Blacksmiths judged the temperature of iron by eye long before anyone could measure it. Steel in a forge passes through a familiar sequence: at first it shows nothing, then a dull cherry red, then bright orange, yellow, and finally a dazzling white. The colour is so reliable that potters and steelmakers still use it as a rough thermometer.
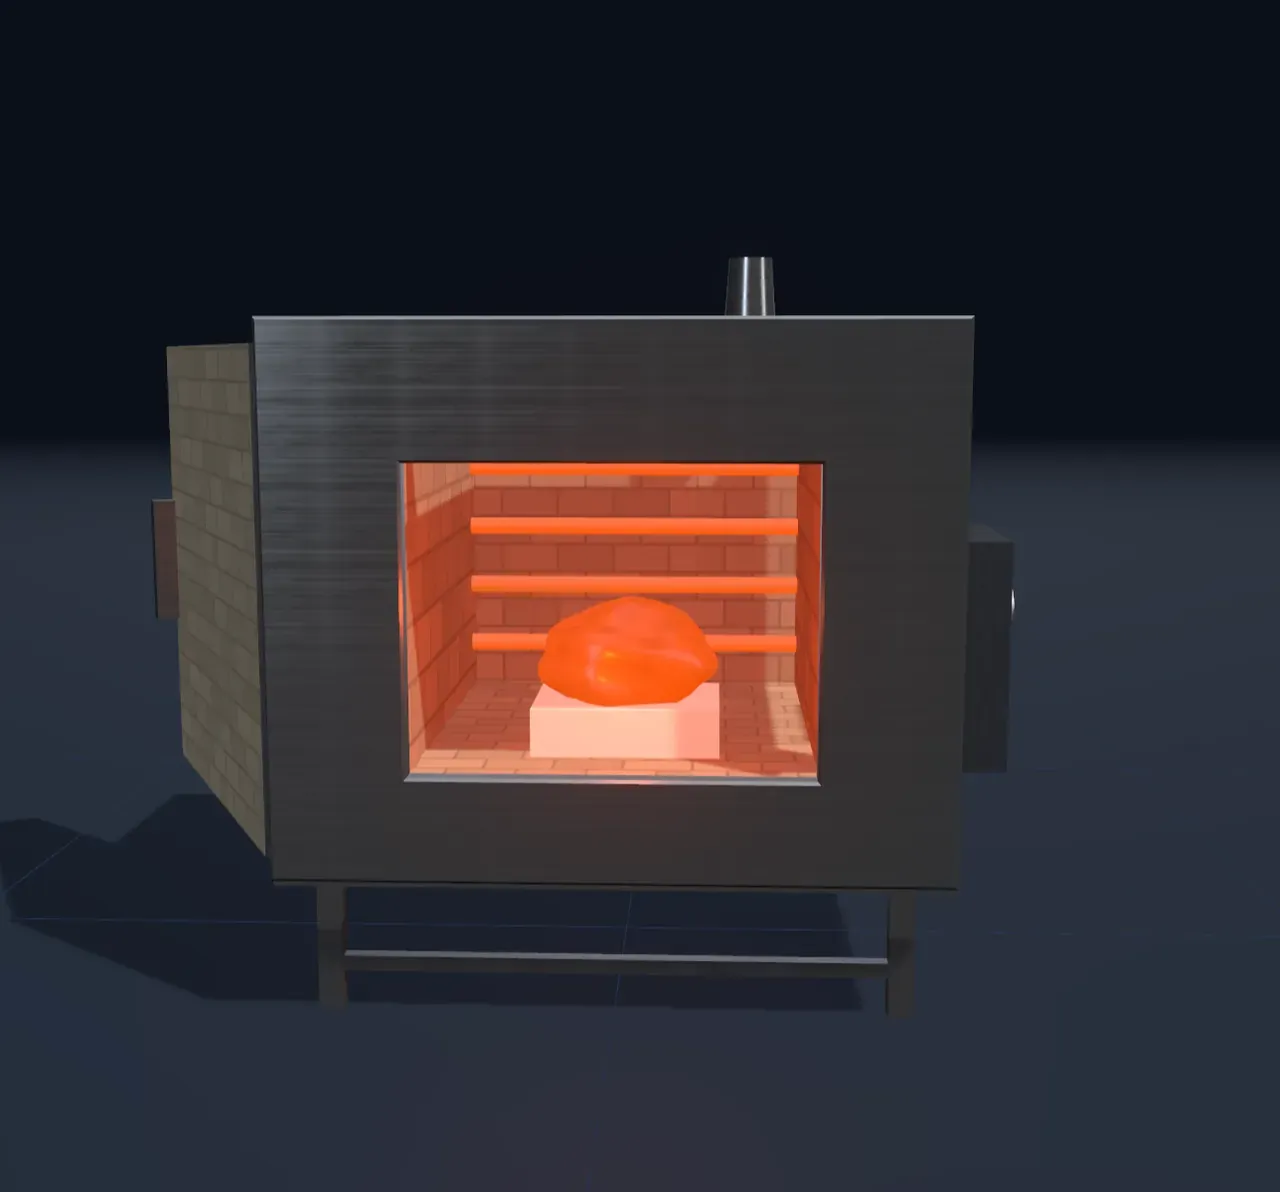
In the scene a lump of tungsten sits in the mouth of an electric furnace. At room temperature it is a grey piece of metal, lit only by the room. Warm it past about 750 kelvin (480 °C) and a faint red glow appears. Keep going and the glow brightens enormously and its colour changes, all the way up to the warm white of a lamp filament at 2,800 kelvin.
Everything glows
The glow is not special to metal or to furnaces. Every object gives off light because of its temperature, called thermal radiation. The atoms and electrons in matter are always jostling, and moving electric charges send out electromagnetic waves. The hotter the matter, the harder the jostling, and the more energetic the light.
At room temperature the waves are infrared, about ten times longer than the light our eyes can see. You give off this kind of light too: a thermal camera sees people glowing in the dark at about 9 micrometres. Only above roughly 750 kelvin does a small part of the glow reach the red end of the visible range, and the lump starts to shine.
Planck’s curve
How much light comes out at each wavelength follows one curve, set by the temperature alone. It rises steeply from short waves, peaks, and falls away slowly into the long infrared. Its shape was found by Max Planck in 1900 and is called Planck’s law.
The colour you see depends on which part of that curve falls between 380 and 750 nanometres, the narrow band your eyes respond to. When the lump is red hot, the band sits far out on the short-wave side of the peak, where the curve is climbing steeply. Red light, the longest visible waves, gets much more of the glow than blue, so the light looks red. As the lump heats, the whole curve moves towards shorter waves and the visible band sits higher up its side, where the slope is gentler. Orange, yellow and green catch up with red, and the mix looks yellow and then white.
Try it: set Temperature of the lump to Red hot and look at the card beside the furnace. Only the red end of the visible band holds any glow. Now pick Lamp filament and the band fills with every colour. Then slide Show the whole spectrum to Whole spectrum to see how small a slice of the glow that band is.
The peak slides: Wien’s law
The peak of the curve moves in a simple way. Its wavelength is inversely proportional to the absolute temperature:
This is Wien’s displacement law. Double the temperature and the peak moves to half the wavelength. At 950 kelvin it is at about 3 micrometres, deep in the infrared. Even a lamp filament at 2,800 kelvin peaks at about 1 micrometre, still out of sight, which is why an old-style bulb turns only about 8 % of its glow into visible light and the rest into heat. The share shows on the card as Visible share.
Much brighter: the Stefan–Boltzmann law
A hotter body does not just shift its colour. It gives off more light at every wavelength, and far more in total. The power from each square metre of surface rises with the fourth power of temperature:
Double the temperature and the power rises sixteen times. The visible part rises faster still, because the curve is also moving into the visible band: from 1,300 to 1,800 kelvin the light the eye sees brightens about 180 times. The card shows the total as Power per m²: about 0.5 kW from a square metre at room temperature, 160 kW at 1,300 kelvin and 3.5 MW at 2,800 kelvin.
Why “blackbody”?
Planck’s curve is exact for an ideal object called a blackbody, one that absorbs all the light that falls on it and reflects none. It sounds odd that the best glower should be black, but the two go together: a surface that is good at absorbing light at some wavelength is equally good at giving it off there. Shiny metal reflects most light, so it glows less brightly than soot at the same temperature, although with much the same colour.
The best real blackbody is a small hole in a hot, closed box. Light that gets into the hole bounces around inside until it is absorbed, so the hole is perfectly black when cold. When the box is hot, the light coming out of the hole follows Planck’s curve exactly. A furnace with its door open is close to this, which is why the lining in the scene glows with the same colour as the lump.
The curve that started quantum physics
Around 1900 physicists could measure the curve but not explain it. The best theory of the time predicted that a hot object should give off ever more light at ever shorter wavelengths, without limit: an absurd result later nicknamed the ultraviolet catastrophe. Planck found the right formula, then explained it by assuming that light of frequency can only be given out in lumps of energy . Short waves need big lumps, and a body at a given temperature rarely has enough energy to spare, so the curve falls away. Planck saw his lumps as a mathematical trick. Five years later Albert Einstein took them seriously as particles of light, and quantum physics began.
The colours of stars
Stars are close to blackbodies too, so their colours tell their surface temperatures. The dashed curve that appears at the end of Show the whole spectrum is the Sun’s, at about 5,800 kelvin. Its peak lies in the visible, near green, and the curve is nearly flat across the visible band, so sunlight looks white. Betelgeuse, at about 3,600 kelvin, looks orange-red; Rigel, at about 12,000 kelvin, peaks in the ultraviolet and looks blue-white. There are no green stars: a curve that peaks in green is so broad that it covers every colour, and the mix looks white.
The same curve, cooled to 2.7 kelvin, fills the whole universe as the cosmic microwave background.
What this model leaves out
- Brightness is compressed. The real glow brightens about four billion times between 800 and 3,000 kelvin. The scene keeps the order and the steep rise but squeezes them to fit the screen, and its dimmest reds are brighter than a real lump would look in a lit room.
- Tungsten is not a perfect blackbody. It gives off less light than an ideal blackbody at the same temperature, about 40 % in the visible, and a little more at blue than at red, so a real filament looks slightly bluer. The scene draws an ideal blackbody.
- The colour is what an eye would see in isolation. Your eyes adjust to the light around them, so a glowing lump next to daylight looks redder than one in a dark forge.
- The furnace is simplified. A real furnace this hot needs graphite or tungsten elements and an argon atmosphere, and the temperatures of its walls and rods would depend on its design.
- The card shows shape, not height. The curve is rescaled to fill the card, and the Sun’s is scaled to its own peak, so the shapes can be compared; in reality the Sun’s curve would tower over the lump’s at every wavelength.