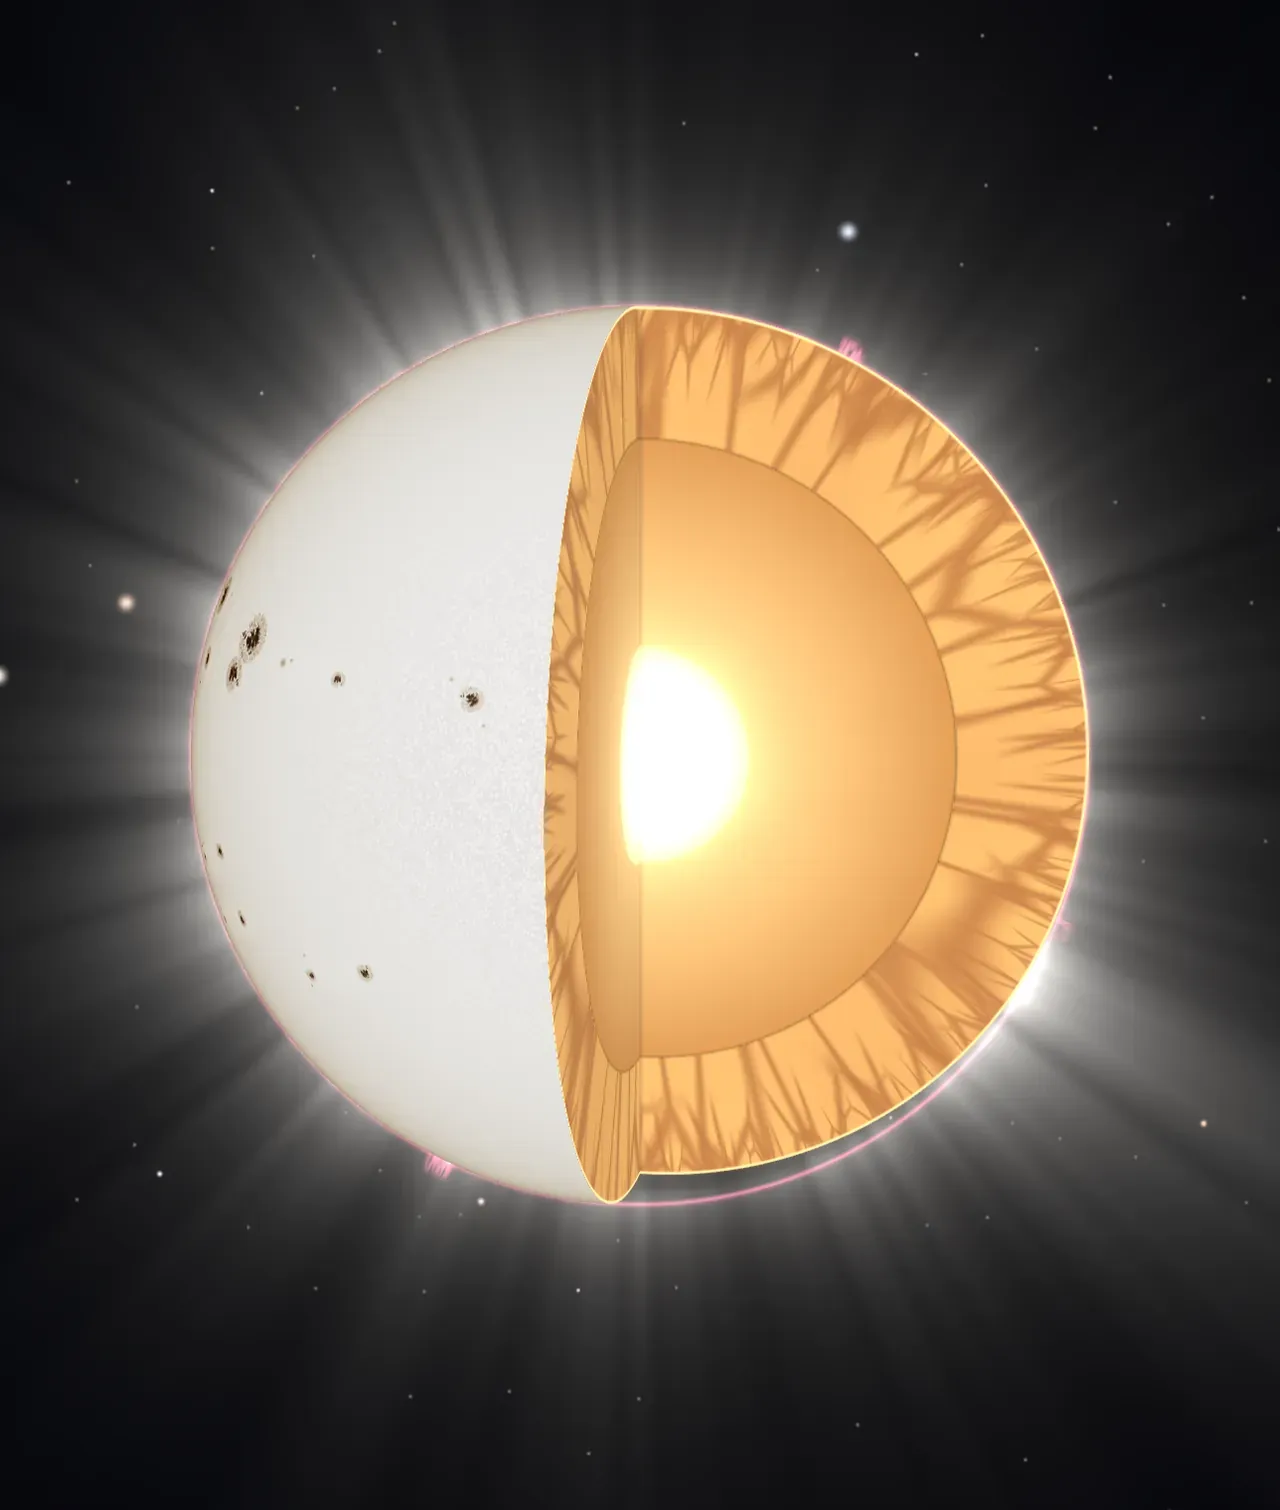
A star up close
The Sun is a ball of hot, electrically charged gas, called plasma, 1.39 million kilometres across: 109 Earths would fit side by side across its face, and it holds 99.8 per cent of the mass of the whole Solar System. It is an ordinary, middle-aged star, about 4.6 billion years into a life of roughly ten billion (see star life cycle).
From Earth it looks like a smooth, steady disc. Seen through a telescope with a proper solar filter, it is neither. Its surface boils, and every few years it breaks out in dark spots that drift across its face as it turns. This article cuts the Sun open to see how it is built, and then follows the slow magnetic rhythm that brings the spots.
From the core to the surface
The Sun is built in layers, and the scene shows them at their real depths, as shares of the radius.
- The core, the inner quarter of the radius, is where the Sun makes its energy. At about 15 million kelvin and more than ten times the density of lead, hydrogen nuclei fuse into helium (see nuclear fusion). Each second about four million tonnes of matter turn into energy.
- The radiative zone, out to about 70 per cent of the radius, passes that energy outwards as light. The gas is so dense that light travels only a tiny distance before it is absorbed and sent off again in a random direction. Staggering outwards like this, the energy takes tens of thousands of years or more to cross the zone.
- The convection zone, the outer 30 per cent, is cool enough and murky enough that light can no longer carry the energy fast enough. Instead the gas itself carries it: hot gas rises, gives up its heat near the top, cools and sinks again, like water in a pan on a stove.
- The photosphere is the visible surface, at about 5,800 kelvin. It is where the gas finally becomes thin enough for light to escape into space, and it is covered in granules, the tops of convection cells about the size of a country, each lasting only ten minutes or so.
Above the photosphere lie the thin, red chromosphere and the corona, the Sun’s outer atmosphere, which stretches millions of kilometres into space. Strangely, the corona is far hotter than the surface beneath it, at one to two million kelvin, and it is one of the open questions of solar physics exactly how the magnetic field heats it. The corona is too faint to see beside the bright disc except during a total eclipse of the Sun, when the Moon blocks the photosphere and the pearly streamers appear. Its gas streams away as the solar wind, which lights up auroras when it reaches the Earth.
Sunspots
A sunspot is a patch of the photosphere where the magnetic field is thousands of times stronger than the Earth’s. The field holds back the convection that carries heat to the surface, so the spot is cooler than its surroundings, about 4,000 kelvin instead of 5,800. It still glows brightly; it looks dark only by contrast. A large spot has a dark centre, the umbra, inside a lighter, streaky ring, the penumbra, and can be several times wider than the Earth. Spots last from days to months, and they drift across the disc as the Sun turns, which is how Galileo showed in 1612 that the Sun rotates.
Spots usually come in groups, and most groups have two main spots side by side along the direction of rotation: a leading spot ahead and a following spot behind. Around them, the surface is laced with bright patches called faculae, which show best near the edge of the disc.
Try it: under Years since solar minimum, press Minimum, then Rising, Maximum and Declining. Watch the spots appear far from the equator early in the cycle, multiply, then thin out ever closer to the equator. The chart beside the scene draws the whole cycle.
The 11-year cycle
In 1843 the German pharmacist Heinrich Schwabe, who had counted sunspots on every clear day for seventeen years, noticed that their number rose and fell in a cycle about ten years long. Astronomers now measure it with the sunspot number, ten for every group of spots on the visible disc plus one for every spot, averaged over months. From one solar minimum, when the Sun can go weeks without a single spot, to the next takes about 11 years on average, though single cycles have lasted from 9 to 14.
Where the spots appear changes through the cycle too. The first spots of a new cycle break out in two bands about 30 degrees north and south of the equator. As the cycle goes on, the bands creep towards the equator, and the last spots appear within about 10 degrees of it, while the first spots of the next cycle are already showing up at high latitudes. Plotted against time, the latitudes of the spots make the pattern Edward and Annie Maunder published in 1904: the butterfly diagram, the lower plot in the chart beside the scene.
Cycles differ in strength. The strongest on record, which peaked in 1958, reached a smoothed sunspot number of about 285; the one that peaked in 2014 reached only about 115. Between about 1645 and 1715, during the Maunder minimum, the Sun showed almost no spots at all for seventy years. That stretch fell within a run of cold centuries in Europe sometimes called the Little Ice Age, though how much the quiet Sun had to do with the cold is still debated.
Try it: set Peak sunspot number to Cycle 19, the record cycle, then to Maunder minimum. The spots, the loops and the corona’s streamers all follow the cycle’s strength, while the layers inside do not change at all.
Around solar maximum, the Sun is more violent as well as more spotted. Flares, sudden bursts of energy over spot groups, and huge clouds of plasma thrown into space are far more frequent, and the corona sprays out in streamers all round the disc. At minimum the corona is quieter and lopsided: long streamers stretch out along the equator and fine plumes rise over the poles. Even the Sun’s total output changes, by about 0.1 per cent, and it is slightly brighter at maximum, because the bright faculae more than make up for the dark spots.
Spots come in magnetic pairs
In 1908 the American astronomer George Ellery Hale measured the magnetic field in sunspots from the way it splits the lines in their spectrum. He found that the two main spots of a group have opposite polarity: the field comes out of the Sun at one and goes back in at the other. The pair are the two feet of one loop of magnetic field arching above the surface. Seen in ultraviolet light, the loops show up as glowing arches of hot plasma.
The polarities follow a strict rule, now called Hale’s law. In one hemisphere, every leading spot of a cycle has the same polarity; in the other hemisphere, the leading spots have the opposite polarity. In the next cycle, both swap. So although the spots come and go every 11 years, the Sun’s magnetism takes 22 years to come back to where it started. A second rule, Joy’s law, says that the following spot usually sits a little nearer the pole than the leading one.
Try it: switch on Show the magnetic field. Loops arch between the spots of each pair, and the surface turns into a map of the magnetic field: sky blue where it points out of the Sun, amber where it points in. Field lines run from pole to pole, wound round the Sun by its spin. Compare the order of the colours in the north with the south.
Why the field winds up
The Sun does not turn as a solid ball. Its equator goes round in about 25 days, but near the poles a turn takes about 35. Because plasma conducts electricity so well, magnetic field lines are carried along with it, almost like threads frozen into the gas.
In the picture that Harold Babcock put forward in 1961, a cycle starts at solar minimum with the field running from pole to pole, rather like a bar magnet’s. The faster-turning equator then drags the field lines round with it, stretching them and wrapping them round and round the Sun, until strong bands of field run east to west deep inside, near the bottom of the convection zone. Bands of strong field are lighter than the gas around them, so stretches of them float up through the convection zone. Where a loop breaks through the surface, it makes a pair of spots, one at each foot, with opposite polarities, and the turning of the Sun gives each loop a slight twist, which is the tilt of Joy’s law.
As the spots break up, the remains of the following spots, which sit nearer the poles, drift poleward and cancel the old field there, then build up a new one pointing the other way. The polar field flips around solar maximum, and by the next minimum the field runs from pole to pole again, but reversed. Then the winding starts over, with every polarity swapped.
Try it: with Show the magnetic field on, move Years since solar minimum slowly from 0 to 11. The field lines wind up round the Sun and relax again, the bands of field on the cut faces creep towards the equator, marked ⊙ where the field comes towards you and ⊗ where it points away, and the colour of the polar caps changes as the poles flip.
How the Sun’s dynamo works in detail is still being worked out. Forecasting how strong the next cycle will be is hard; the best single guide so far is how strong the field at the poles is at the start of the cycle.
What this model leaves out
- Sizes and speeds. The spots are drawn about one and a half times their real size, and the granules about six times theirs, so they still show when you zoom in. The Sun turns once a minute. The surface turns as a whole; the faster equator shows only in how the field lines are wound.
- A smooth, regular cycle. The model’s cycle is exactly 11 years long, both hemispheres keep in step, and the sunspot number follows a smooth average curve. Real cycles vary in length and shape, and the two hemispheres can be a year or more apart.
- The winding is schematic. Over a real cycle the faster equator would wrap a field line round the Sun many times, and the field is a tangle, not a few neat lines. The lines are drawn just above the surface, although the winding happens deep inside. Where exactly the bands of strong field sit is still debated.
- Convection is tidier than it is. The convection zone is drawn as broad warm upflows between narrow cool plumes of sinking gas, which merge into fewer, wider ones with depth, a simplified version of what simulations show; the real one churns far more, on every scale at once. Flares are drawn as brief flashes, and the clouds of plasma the Sun throws out and the solar wind are left out.
- The corona is made visible. The real corona is about a million times fainter than the photosphere and is drawn far brighter here. The magnetic loops glow in ultraviolet light and X-rays, not in the visible light of the rest of the picture, and the colours of the magnetic map are a choice, not something you would see.