Where the cart is, with a sign, and how its position graph tells you how fast and which way it is going. A constant velocity is a straight line, and the velocity is its slope.
Step 1 of 6 · Position with a sign
In the measurement Unit you saw that displacement and velocity have a direction. Here that idea goes to work on the simplest motion there is: a cart moving along a straight track. A straight line has only two directions, so a direction is simply a sign, plus or minus.
Step 1 of 6
Position with a sign
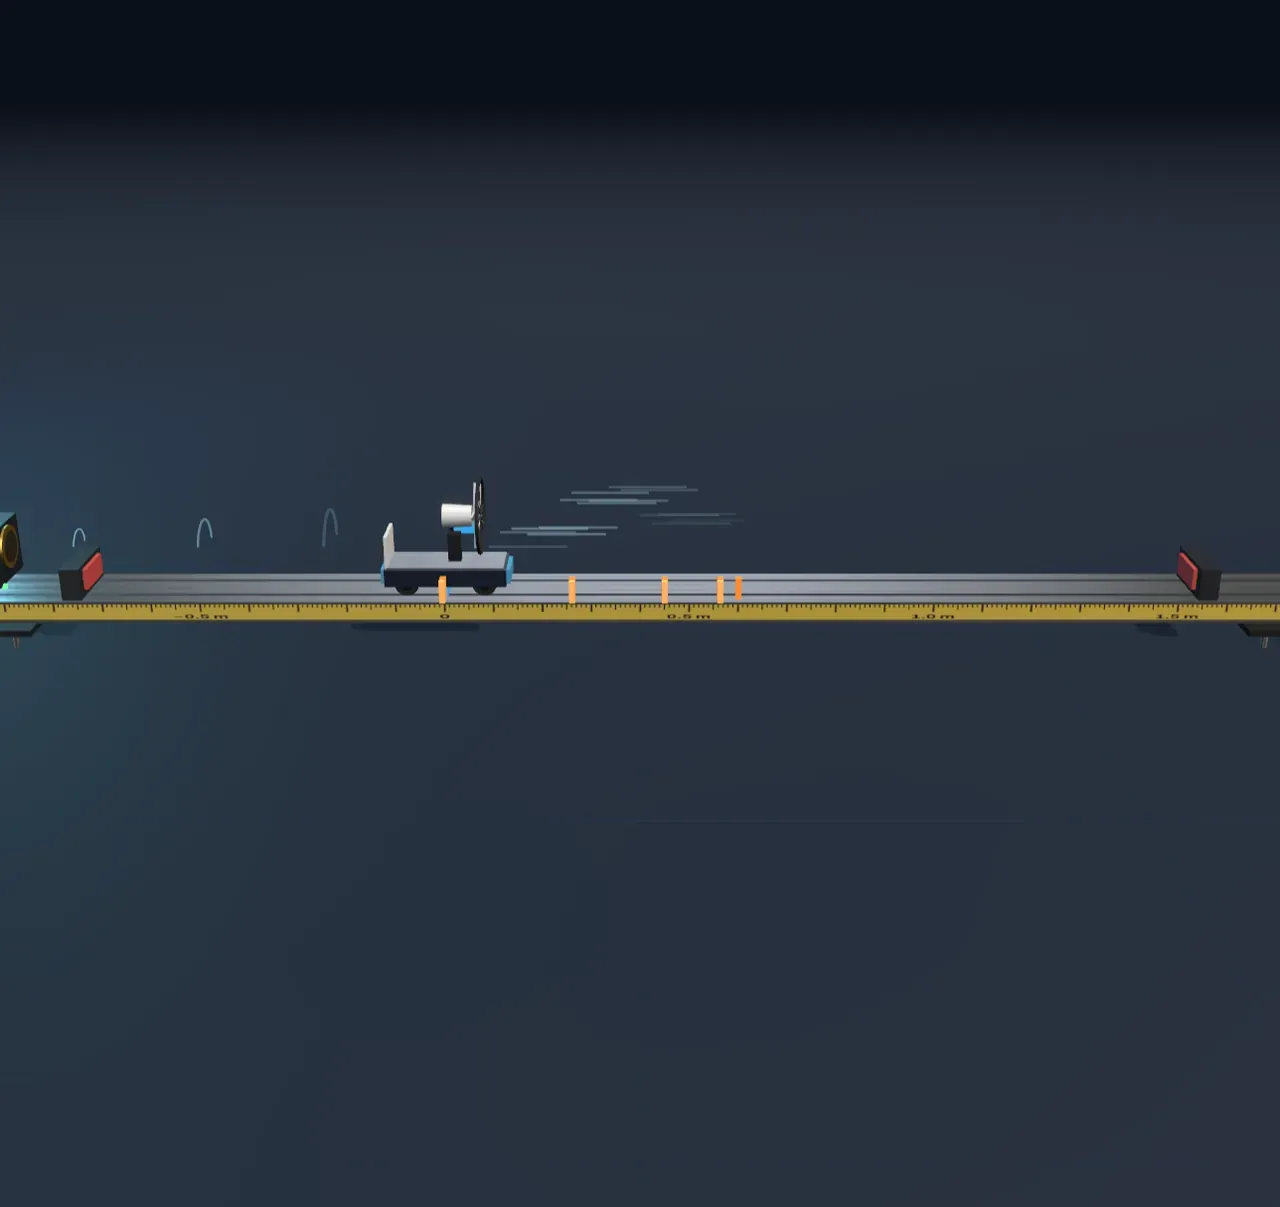
A measuring tape in metres runs along the track, with its zero at the blue start line. The cart’s position, , is the number on the tape beneath it. The motion sensor stands at the near end of the track, and positive is away from it. So a position on the sensor’s side is a negative number.
In the scene the cart crosses the start line heading for the sensor, rolls up to the end stop and stops there. The end stop is 0.6 m from the start line. The position graph beside the scene plots against time.
Step 2 of 6
Without a push
Now the fan is off and the cart is standing on the start line. Its position graph is a flat line at zero: time passes and the position does not change.
In a moment the cart will cross the start line at 0.3 m/s, away from the sensor, and the fan will stay off. There is no friction in this model. Predict what the position graph will look like, and only then watch.
Step 3 of 6
Velocity is the slope
A cart moving at a constant velocity covers the same distance every second, so its position changes by the same step every second: the position graph is a straight line. This is uniform motion, motion at a constant velocity.
In the linear functions Unit you saw that the slope of a line is its rise over its run. On a position–time graph the rise is the change in position, , and the run is the time that passed, . Their ratio is the velocity:
Its unit is metres per second, m/s. And just as , the position in uniform motion is
where is the position when , the intercept on the vertical axis, and is the slope. In the scene , because the clock starts as the cart crosses the start line.
Step 4 of 6
Negative velocity
When the cart travels towards the sensor, its position gets smaller with time and the position graph slopes down. The slope is negative, so the velocity is negative too. The sign of the velocity is the direction; the number without its sign is the speed, how fast.
Starting velocity is hidden now. Look at the position graph: where is the cart after the four seconds, and what velocity does that mean?
Step 5 of 6
The equation of uniform motion
describes any motion at a constant velocity, not just a cart on a track. The starting position is wherever the object is when you start timing, and it need not be zero. The velocity is negative when the object moves in the negative direction.
Try it: move Starting velocity between 0.6 m/s and −0.4 m/s, and watch the position graph change its slope. The steeper the line, the faster the cart.
Step 6 of 6
Summary
- Position is measured from a zero point, with a sign that says which side of it the object is on.
- In uniform motion the position graph is a straight line, , and its slope is the velocity, .
- A negative velocity means motion in the negative direction; the speed is the number without its sign.
- In the next Lesson the fan comes on, and the velocity itself starts to change.
Loading the interactive version…
Loading the interactive version…
Each step sets up the Scene for you, and a control marked “fixed” stays put for that step.
Practice · Calculate
The cart travelled towards the sensor and stopped at the end stop, 0.6 m from the start line on the sensor’s side. What is the cart’s position now?
Practice · Calculate
The cart travelled towards the sensor and stopped at the end stop, 0.6 m from the start line on the sensor’s side. What is the cart’s position now?
Practice · Predict, then look
The cart will cross the start line at 0.3 m/s, away from the sensor. The fan is off and there is no friction. What will the position graph look like?
Practice · Predict, then look
The cart will cross the start line at 0.3 m/s, away from the sensor. The fan is off and there is no friction. What will the position graph look like?
Practice · Calculate
The cart crosses the start line at 0.35 m/s, and the fan is off. What is its position after three seconds?
Practice · Calculate
The cart crosses the start line at 0.35 m/s, and the fan is off. What is its position after three seconds?
Practice · Calculate
The position graph falls in a straight line: from at t = 0 to −0.4 m at t = 4 s. What is the cart’s velocity?
Practice · Calculate
The position graph falls in a straight line: from at t = 0 to −0.4 m at t = 4 s. What is the cart’s velocity?
Practice · Choose
A runner on a straight track is at x = 20 m when timing starts, and runs towards the zero point at a steady 4 m/s. Which equation gives her position, in metres and in seconds?
Practice · Choose
A runner on a straight track is at x = 20 m when timing starts, and runs towards the zero point at a steady 4 m/s. Which equation gives her position, in metres and in seconds?
Lesson complete. Every practice question here is done.