Three graphs of one trip. What the height says and what the slope says, how to read an acceleration off the velocity graph, and why the area under the velocity graph is the displacement.
Step 1 of 7 · The graph is not a picture of the path
In the last two Lessons you saw that velocity is the slope of the position graph, and acceleration is the slope of the velocity graph. Here you read all three graphs together and add one more thing to them: the area.
Step 1 of 7
The graph is not a picture of the path
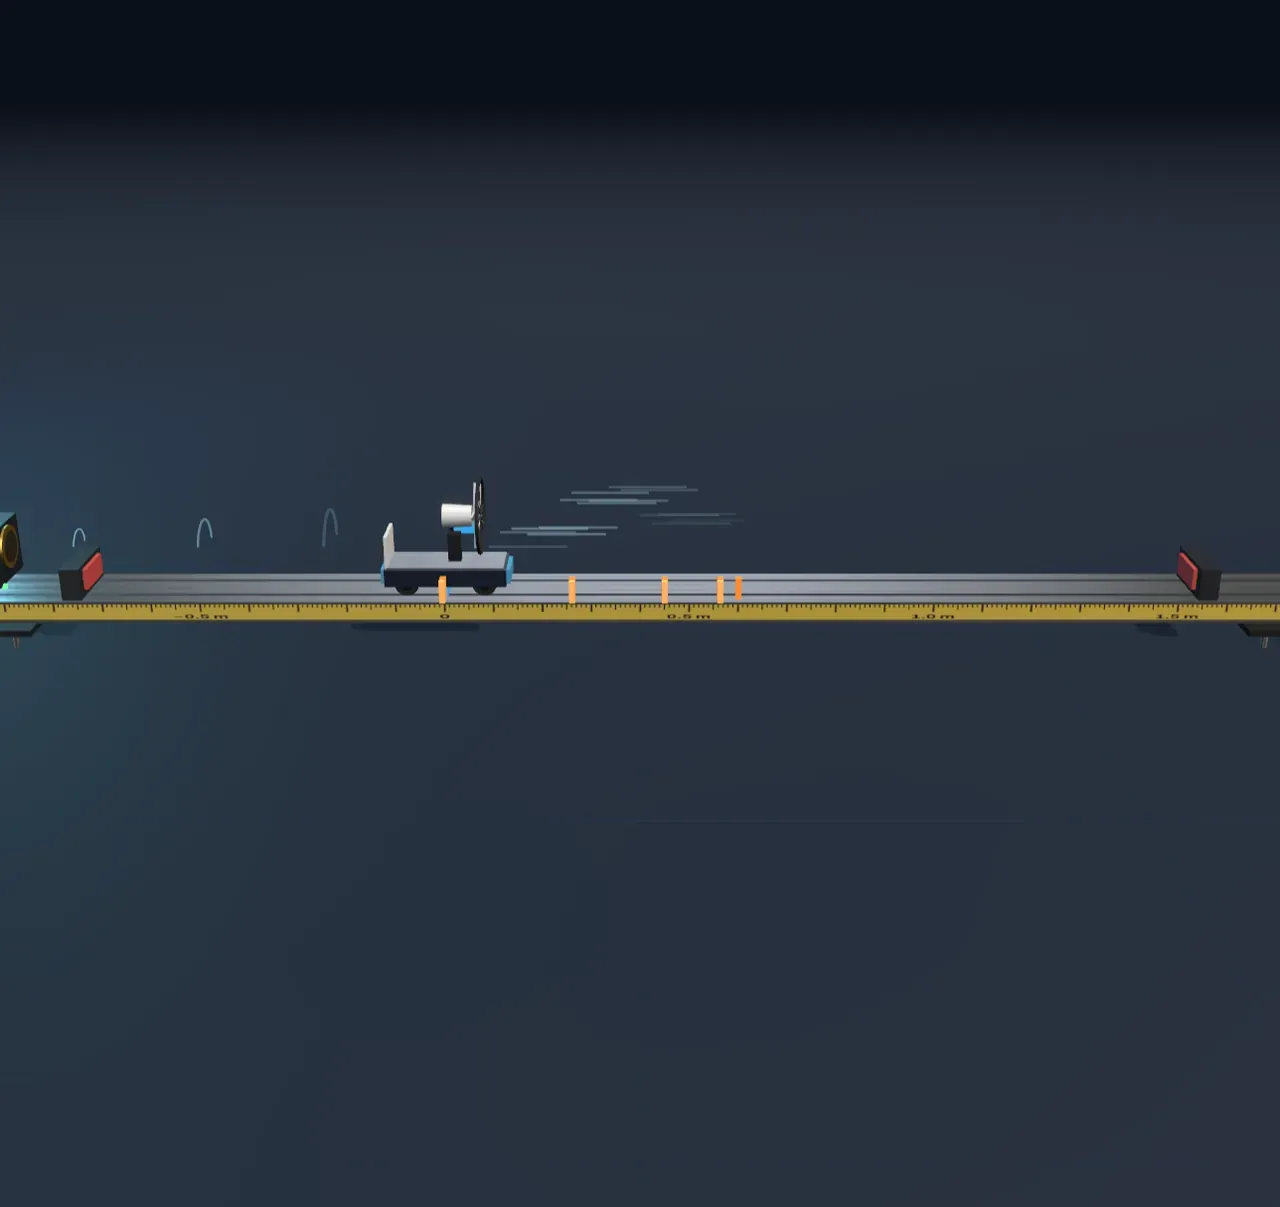
In this run, starting at 0.6 m/s with an acceleration of −0.3 m/s², the position graph is an arch. It is easy to see a hill in it, but the track is straight and level. The vertical axis is the position on the track, and the horizontal axis is time.
Of any motion graph you ask two different questions: what is its height at a given moment, and what is its slope at that moment. On the position graph the height is where the cart is, and the slope is its velocity.
Step 2 of 7
The slope of the velocity graph
Now Starting velocity and Acceleration are hidden, and the numbers beside the graphs are switched off: there are only the lines and the grid. The velocity graph is a straight line, so its slope is the same everywhere and you can measure it between any two points: the change in velocity divided by the time that passed.
The velocity graph starts at 0.5 m/s and four seconds later ends at −0.5 m/s. Find the acceleration, and check your answer against the acceleration graph below it.
Step 3 of 7
The area under the velocity graph
A cart moving at 0.5 m/s for two seconds covers one metre. On the velocity graph that is a rectangle high and wide, and its area is that same metre. It holds for any shape: the area between the velocity graph and the time axis is the displacement. Area above the axis counts forward, and area below it counts back.
In this run the velocity rises in a straight line from 0.1 m/s to 0.5 m/s in four seconds. The area under it is a trapezium: a rectangle with a triangle on top.
Try it: once you have answered, step Build the graphs to Area under velocity, and watch the area fill in as the cart moves.
Step 4 of 7
Distance and displacement
In the run starting at 0.6 m/s with an acceleration of −0.3 m/s², the area under the velocity graph is made of two triangles: one above the axis, for the two seconds of the trip out, and one below it, for the trip back. The displacement is their sum, with the lower triangle counting as negative. The distance travelled counts both as positive: every metre the cart covered.
Step 5 of 7
Average velocity
The average velocity is the displacement divided by the time, : the constant velocity that would have brought the cart to the same place in the same time. Divide the distance by the time instead and you get something else: the average speed, which does not say which way.
In this run the acceleration is −0.2 m/s². The cart moves away, stops after three seconds 0.9 m from the start line, and comes back 0.1 m by the end of the run.
Step 6 of 7
Out and back
Now you can change Starting velocity and Acceleration, and the lines under the graphs show the displacement and the distance at the end of the run. In a run that comes back to the start line, the two triangles under the velocity graph are the same size.
Step 7 of 7
Summary
- On a position–time graph the height is the position and the slope is the velocity; on a velocity–time graph the height is the velocity and the slope is the acceleration.
- The area between the velocity graph and the time axis is the displacement; area below the axis counts as negative.
- The distance travelled counts every stretch as positive, so after a turn it is bigger than the size of the displacement.
- The average velocity is the displacement divided by the time. With constant acceleration it is also the average of the starting and final velocities.
Loading the interactive version…
Loading the interactive version…
Each step sets up the Scene for you, and a control marked “fixed” stays put for that step.
Practice · Choose
The position graph of this run is an arch: it rises, peaks after two seconds and falls back to zero after four. What did the cart do?
Practice · Choose
The position graph of this run is an arch: it rises, peaks after two seconds and falls back to zero after four. What did the cart do?
Practice · Calculate
The velocity graph falls in a straight line from 0.5 m/s at t = 0 to −0.5 m/s at t = 4 s. What is the cart’s acceleration?
Practice · Calculate
The velocity graph falls in a straight line from 0.5 m/s at t = 0 to −0.5 m/s at t = 4 s. What is the cart’s acceleration?
Practice · Calculate
The cart’s velocity rises in a straight line from 0.1 m/s to 0.5 m/s in four seconds. What is its displacement in those four seconds?
Practice · Calculate
The cart’s velocity rises in a straight line from 0.1 m/s to 0.5 m/s in four seconds. What is its displacement in those four seconds?
Practice · Calculate
In this run, v₀ = 0.6 m/s and a = −0.3 m/s², the cart is back on the start line at the end of the four seconds, and its displacement is zero. What distance did it travel?
Practice · Calculate
In this run, v₀ = 0.6 m/s and a = −0.3 m/s², the cart is back on the start line at the end of the four seconds, and its displacement is zero. What distance did it travel?
Practice · Calculate
The cart crosses the start line at 0.6 m/s with an acceleration of −0.2 m/s². It stops after three seconds 0.9 m from the start line, and comes back to 0.8 m by the end of the four seconds. What is its average velocity over the four seconds?
Practice · Calculate
The cart crosses the start line at 0.6 m/s with an acceleration of −0.2 m/s². It stops after three seconds 0.9 m from the start line, and comes back to 0.8 m by the end of the four seconds. What is its average velocity over the four seconds?
Practice · Reach the target
Find a run in which the cart is back on the start line exactly at the end of the four seconds, having travelled a distance of 0.8 m. Change Starting velocity and Acceleration, and press Check.
Practice · Reach the target
Find a run in which the cart is back on the start line exactly at the end of the four seconds, having travelled a distance of 0.8 m. Change Starting velocity and Acceleration, and press Check.
Lesson complete. Every practice question here is done.