One case in a crowd
An infectious disease travels from person to person. Someone who is ill breathes, coughs or touches things near other people, and some of those people catch it. Each of them then passes it on in turn. Whether that chain dies out after a few links or runs through a whole city depends on one thing above all: how many people, on average, each case infects.
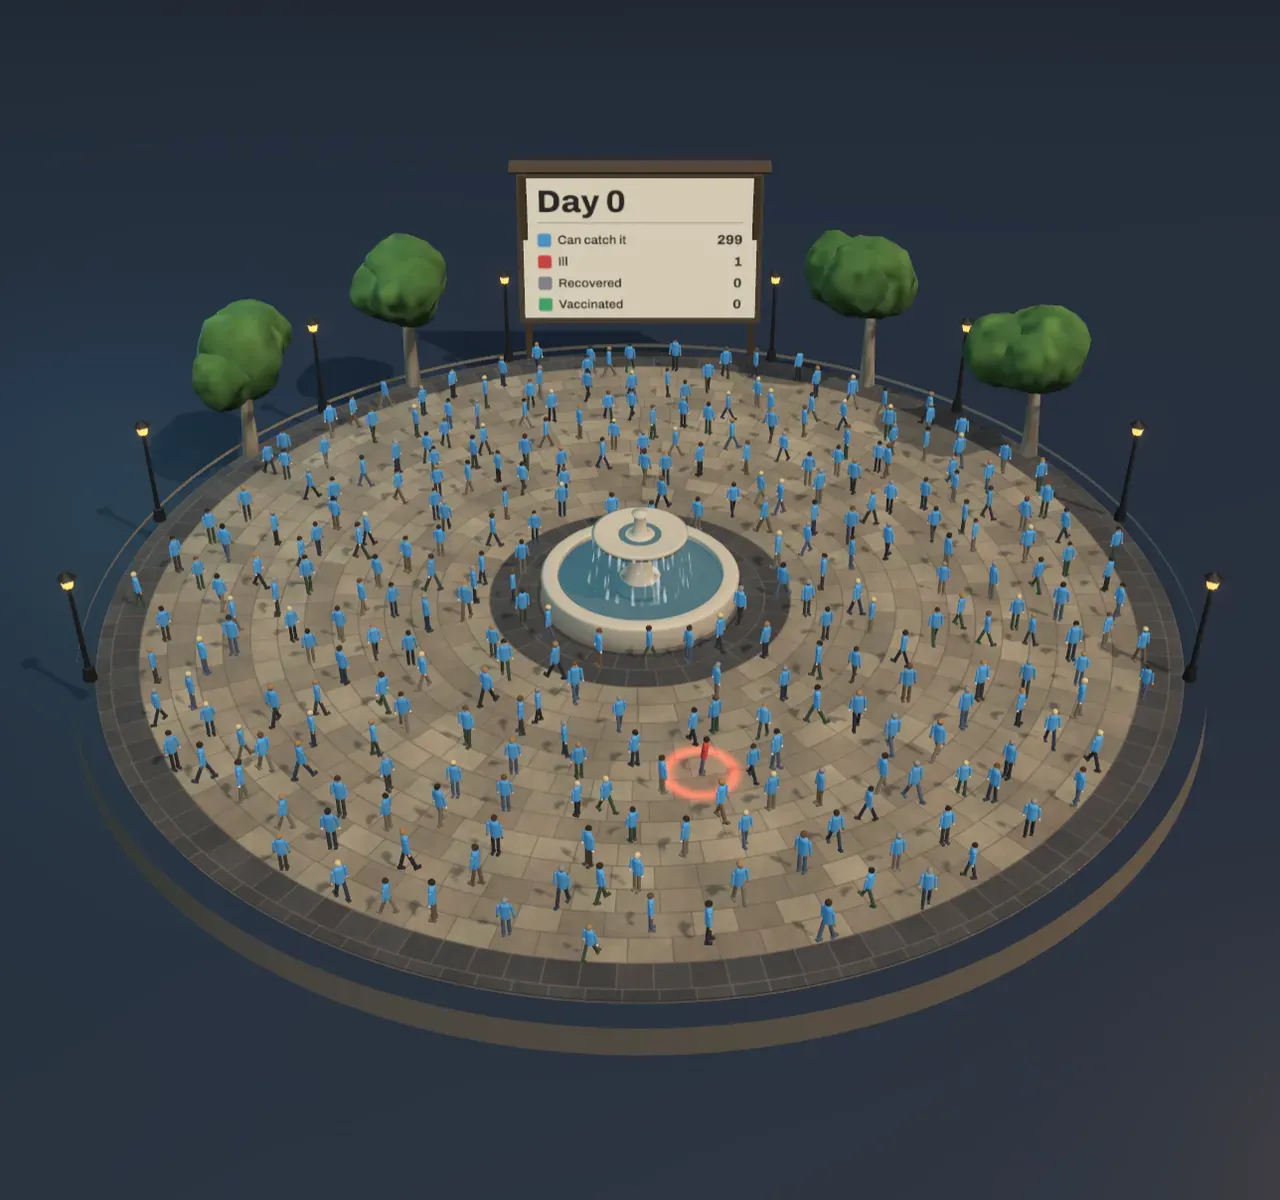
The Scene starts with a crowd of 300 people milling round a fountain. One of them, in a red shirt, is ill. Everyone else, in blue, could still catch it. When someone catches it, a puff of droplets drifts to them from the person who infected them, and their shirt turns red as it lands. After about five days of being ill and infectious they recover and turn grey: they are now immune and cannot catch it again. Green shirts are people vaccinated before the first case arrived.
Try it: drag Days slowly from First case to Day 120. One case becomes a handful, the handful becomes dozens, and within three weeks a quarter of the square is ill at once. Then the red fades, and the outbreak is over. Stop on any day while the Scene is moving and watch: the newest few cases replay one at a time, each a puff of droplets from an ill person to the one it infects, whose shirt then turns red.
R₀, the people one case infects
Epidemiologists call the number of people one case infects in a crowd where nobody is immune the basic reproduction number, written R₀ and said “R nought”. It mixes the disease and the way people live: how easily the germ passes between two people, how many people an ill person meets each day, and how many days they stay infectious.
If R₀ is below 1, each case on average infects fewer than one other person and every chain of cases dies out. If R₀ is above 1, each case is replaced by more than one, and the number of cases multiplies, at first like compound interest. In this crowd, with R₀ at 2.5 and five infectious days, the number of cases roughly doubles every two to three days. That is the exponential growth described in Exponential growth and logarithms.
Common estimates of R₀ are about 1.3 for seasonal flu, about 2.5 for COVID-19 in 2020, and between 12 and 18 for measles, one of the most contagious diseases known.
Try it: choose Measles under R₀: people one case infects. Almost the whole crowd falls ill within ten days. Then choose Seasonal flu: the outbreak creeps along for months, never makes many people ill at once, and passes about half the crowd by.
Chance matters most at the very start. Even with R₀ well above 1, the first case may recover before meeting anyone who catches it. With R₀ at 2.5, a single case starts a real outbreak only a little more than half the time. The Scene always shows a run that takes off when one can, because that is the case worth studying.
Why the outbreak peaks
Watching who infects whom shows something the averages hide: not every contact infects someone. A contact with someone who has recovered, or who has been vaccinated, is wasted. At the start almost everyone is still susceptible, so each case passes the disease to nearly R₀ others. As the outbreak grows, more and more of the people an ill person meets are already immune.
The number each case really infects at a given moment is the effective reproduction number, R. It is R₀ times the share of people who can still catch it. While R is above 1, cases keep growing. When the share that can still catch it falls to 1/R₀, R falls to 1, and the number of people ill at once stops rising. That moment is the peak. After it, each case infects fewer than one other, and the outbreak shrinks.
The chart beside the Scene shows this. The blue curve is the share who can still catch it; the dotted blue line is 1/R₀. The red curve, the share ill, peaks just as the blue curve crosses the dotted line.
Why it stops before everyone is ill
An outbreak does not end with everyone ill. After the peak, cases fall, but there are still many ill people, and each of them infects a few more on the way down. So the outbreak overshoots: with R₀ at 2.5 the crowd becomes immune enough to stop growth when 60% have had it, but by the time the last case recovers about 89% have been ill. The rest, about one in ten, never catch it at all. Nothing protects them except that the disease ran out of people to reach before it reached them.
The grey curve settles at that final share. Lower R₀ means a lower, later peak and a smaller final share; with R₀ at 1.3 about half of a crowd never catch it, and only a few per cent are ill at the same time.
Herd immunity
Vaccination changes the starting point. A vaccinated person is immune before the first case arrives, so every contact with them is wasted from the start. If the share vaccinated is large enough that fewer than 1/R₀ of people can catch the disease, R starts below 1 and an outbreak cannot grow at all. A case arrives, infects one or two people, and the chain dies out. This is herd immunity, and the share needed is
For R₀ = 2.5 that is 60% of the crowd. For measles, with R₀ around 15, it is about 93%, which is why health services aim for 95% of children to be vaccinated against it.
Herd immunity protects the people who are not immune: babies too young for the vaccine, people whose immune systems are weak, and people for whom a vaccine did not work. They are safe because the people around them cannot pass the disease on, not because they are protected themselves.
Try it: keep R₀ at COVID-19 in 2020, slide Vaccinated to 50%, and drag through the days. The outbreak still happens, but its peak is much lower and later; the dashed red line on the chart is the outbreak the same R₀ would cause with nobody vaccinated. Now raise Vaccinated to 75% or more: a handful of people catch it, and the chain dies out. Just above 60% a chain can still run for a while, because each case is replaced by almost one.
Vaccinating even below the threshold helps. Every vaccinated person removes contacts, so the peak is lower and fewer people catch the disease in all, including many who were not vaccinated. Hospitals care most about the peak, because that is when the most people need a bed at once.
The SIR model
In 1927 William Kermack and Anderson McKendrick, working in Edinburgh, wrote down the model the Scene is built on. They split a population into three groups: Susceptible, those who can catch the disease; Infected, those who have it and can pass it on; and Recovered, those who are immune. People move only one way, from S to I to R. In a large, well-mixed population the groups change as
Here is the population, is how many people an ill person infects per day in a crowd where everyone can catch it, and is the share of the ill who recover each day, so is the length of an infection. Then . The infected group grows only while , which is the same as : the peak rule above, in symbols.
The crowd in the Scene runs the same rules person by person, with chance deciding who meets whom and when each person recovers. With hundreds of people the curves come out close to what the equations predict, but each run is a little different, as real outbreaks are.
What this model leaves out
- Real crowds mix unevenly. People meet family and colleagues far more often than strangers. Diseases spread fast inside close groups and slowly between them, and a few people who meet very many others can drive much of an outbreak.
- Behaviour changes. When an outbreak is in the news, people stay home, wear masks or meet fewer others, which lowers R. The model keeps everyone’s habits fixed.
- Not every disease follows S, I, R. Many have a stage when people have been infected but cannot yet pass it on. Immunity after some infections fades, so people return to the susceptible group, which is how diseases like flu come back every winter. Some people never show symptoms but still pass the disease on.
- Vaccines are not perfect. A real vaccine protects most people, not all, and protection against some diseases wanes. Then more than 1 − 1/R₀ must be vaccinated to reach herd immunity.
- The crowd is closed. Nobody is born, dies, arrives or leaves. In a real city new susceptible people keep arriving, through birth or travel, so a disease can come back years later.
- Chance at the start. The Scene always shows an outbreak that takes off when it can. In reality many single cases die out unnoticed, which is one reason outbreaks are hard to predict. Viruses shows what happens inside one infected cell.