Two populations on one meadow
An ecosystem is a community of living things together with the place they live in: the soil, water, light and weather, and every plant, animal, fungus and microbe that feeds on or is fed on by the others. Each kind of living thing in it forms a population, all the members of one species in one place, and the size of each population changes as its members are born, die, arrive and leave. How those numbers change, and how one population’s numbers push another’s around, is called population dynamics.
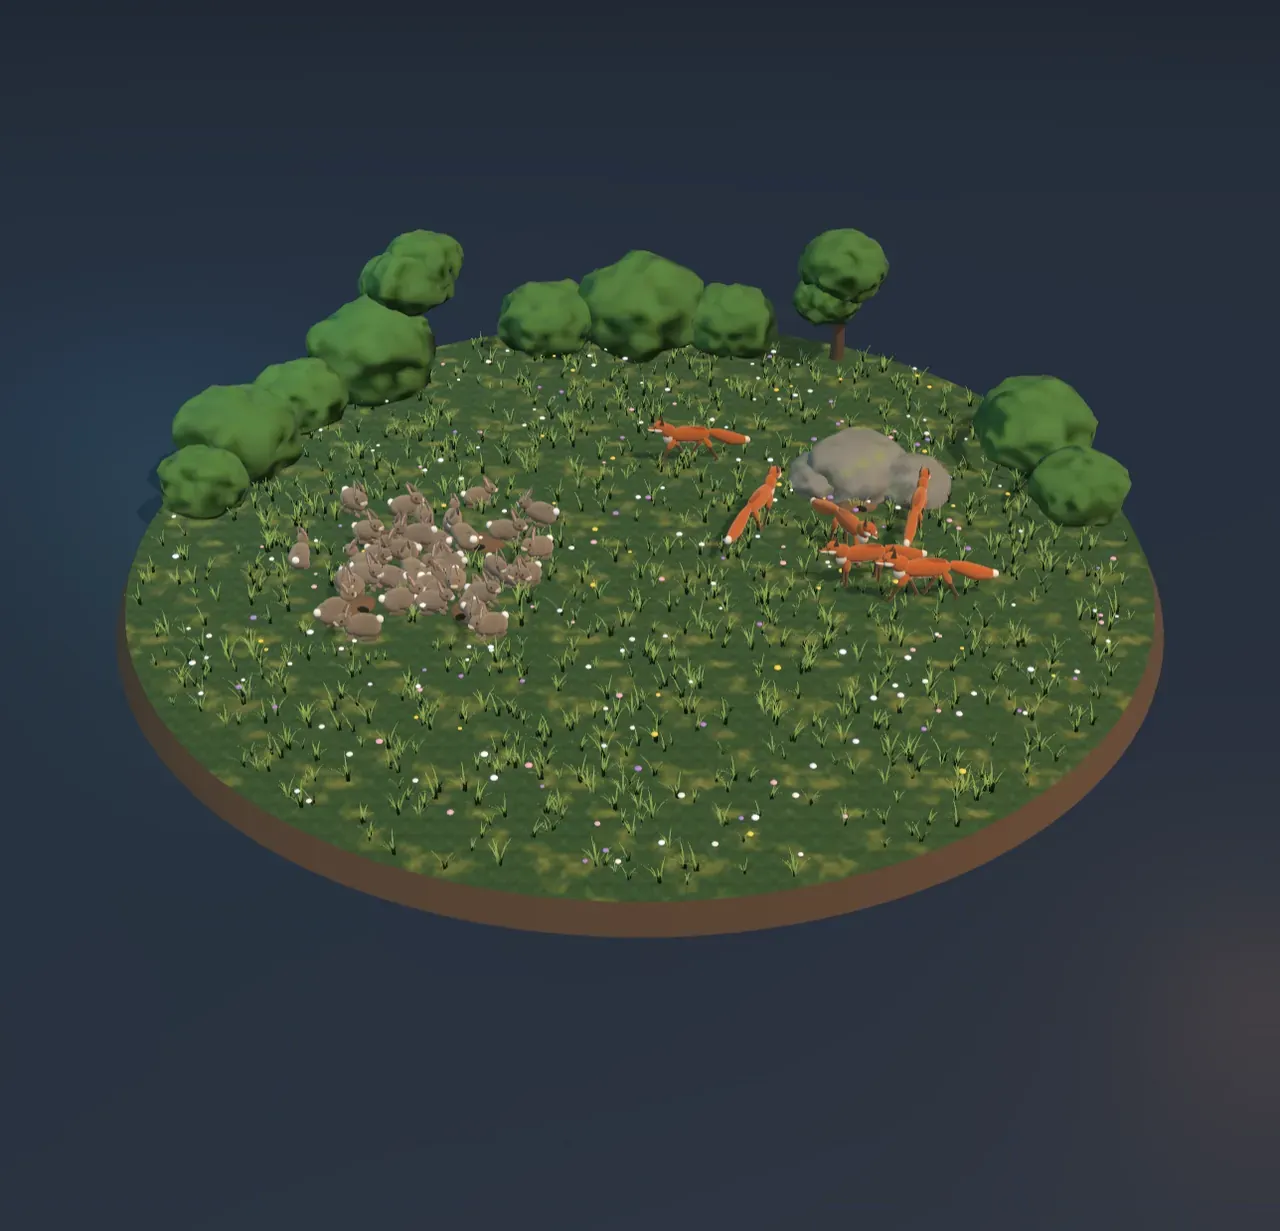
The Scene strips an ecosystem down to two populations: wild rabbits, which eat grass, and red foxes, which eat rabbits. The fox is the predator and the rabbit its prey. In year 0, 40 rabbits and 6 foxes live on the meadow. Every figure you see is one animal: as a population grows, new animals appear outward from the warren on the left and the foxes’ earth under the boulders on the right.
Try it: drag Years slowly from Start to 40 years on. The rabbits boom first, filling the meadow. About a year later the foxes peak, just as the rabbits crash. Then the foxes go hungry and dwindle, the few rabbits left start to multiply again, and the whole thing repeats.
Four quarters of a cycle
Each population’s growth depends on the other’s size, and that is enough to make them cycle. Follow one turn, using the Callouts in the Scene:
- Few foxes: the rabbits multiply. With few predators about, more rabbits are born than are caught, and their numbers grow like compound interest, the exponential growth of Exponential growth and logarithms.
- Plenty of rabbits: the foxes raise more cubs. Each fox now catches more than it needs to replace itself, so foxes multiply too, and both populations rise together.
- So many foxes that rabbits are eaten faster than they are born. The rabbits peak and crash. The foxes keep growing for a while, because there are still plenty of rabbits to catch.
- Rabbits are scarce: the foxes go hungry. The foxes now catch too little to raise enough cubs to replace those that die, so their numbers fall too, until there are so few of them that the rabbits can recover and the cycle starts again.
The turning points have exact positions. The rabbits stop growing when there are just enough foxes to eat each year as many rabbits as are born, and the foxes stop growing when there are just enough rabbits to raise as many cubs as foxes die. With the Scene’s settings these are 15 foxes and 120 rabbits. Each population turns every time the other one crosses its line, which is why the foxes’ peak always comes after the rabbits’. Here the foxes peak about a year after the rabbits, and one whole cycle takes about eight years.
The loop
The first chart beside the Scene plots both populations against the years: two waves, the fox wave a little behind the rabbit wave. The second plots the same run differently, with rabbits across and foxes up, so each moment is a single point. As the years pass the point goes round anticlockwise: right along the bottom as the rabbits boom, up the right side as the foxes catch up, left along the top as the rabbits crash, and down the left side as the foxes starve.
After one turn the point comes back to exactly where it started, 40 rabbits and 6 foxes, and from there the run can only repeat itself. That closed loop is the predator–prey cycle. The cross inside it is the balance point. If the meadow ever held exactly 120 rabbits and 15 foxes, births and deaths would match for both and nothing would change; any other start goes round a loop about that point for ever.
The model is a pair of equations written down independently by the American scientist Alfred Lotka in 1925 and the Italian mathematician Vito Volterra in 1926. With rabbits and foxes,
Here is the rabbits’ birth rate, the Scene’s Rabbit birth rate; is how many rabbits each fox catches per rabbit on the meadow per year, which the Scene sets from Hunting success; is the share of a cub each rabbit eaten raises, a tenth here; and is the rate at which foxes die, 0.8 per fox per year. The term counts meetings between the two that end in a meal: it grows with the number of rabbits and the number of foxes. The same kind of term drives an epidemic in Epidemics and the SIR model, where it counts meetings between the ill and the healthy.
Setting both rates of change to zero gives the balance point: rabbits and foxes. It is also the average of each population over one whole turn of the loop, however big the loop is.
The averages hold a surprise
Those two formulas say something unexpected. The rabbits’ birth rate appears only in the foxes’ average, and the foxes’ death rate only in the rabbits’.
Try it: slide Rabbit birth rate up to 1.5 per year. The rabbits boom higher and the cycle turns faster, but look at the cross on the loop: the rabbits’ average stays at 120. The extra rabbits feed extra foxes, whose average rises from 15 to 22.5.
So a run of good breeding years does not leave a meadow with more rabbits on average. It leaves it with more foxes. Better hunting has a different surprise.
Try it: slide Hunting success up to 40 %. Both averages fall, to 60 rabbits and 7.5 foxes. Foxes that catch twice as well end up half as many, because they eat their prey down to a level that can support only a few of them.
Volterra came to these equations through fish. The young biologist Umberto D’Ancona, later his son-in-law, had noticed that during the First World War, when fishing in the northern Adriatic almost stopped, sharks, rays and other predatory fish made up a much larger share of the catch at the ports. Fishing takes predators and prey alike. In the model, an extra death rate for both lowers the predators’ average and raises the prey’s, and when fishing stopped the balance swung back towards the predators. The same reasoning warns that a pesticide which kills both a crop pest and the insects that eat it can leave the pest more common than before.
Real cycles
The best-known real cycle is in the forests of Canada, where the snowshoe hare and the Canada lynx that hunts it rise and fall about every ten years. The Hudson’s Bay Company kept records of the pelts trappers sold to it for more than a century, and the lynx peaks in them come a year or two after the hare peaks, as in the Scene. Voles and lemmings in the far north, and the owls, stoats and foxes that hunt them, cycle every three to five years.
Real cycles are messier than the loop. Hares also run short of food in their peak years, so their crash is partly hunger as well as lynxes. Weather, disease and other predators push both populations around, so no two cycles are the same height. Many predator and prey populations do not cycle at all, because the predator has other food to switch to or the prey has places to hide.
Try it: slide Rabbit birth rate down to 0.6 per year and Hunting success down to 15 %. In the troughs only two foxes are left, and in the model fewer than two. The equations bring them back, but a real meadow would very likely lose them for good, and then the rabbits would multiply until the grass ran out.
That is one reason a predator matters to the rest of its ecosystem. Without foxes, nothing but food holds the rabbits back, and a population that eats its own food supply down can damage the plants, and everything that lives on them, for years. Who eats whom, and how energy passes from grass to rabbit to fox, is the subject of food chains and food webs. Predators are also a force of natural selection: the rabbits most likely to be caught are the slowest and the least watchful, so every generation of foxes leaves a slightly harder-to-catch generation of rabbits.
What this model leaves out
- Grass that never runs out. With no foxes, the model’s rabbits would multiply for ever. Real rabbits are held back by food and space too. Adding that limit turns the closed loop into a spiral that winds in to a steady balance, and real populations often settle like that.
- Whole animals and chance. The equations treat a population as a smooth number, so they can bring the foxes back from 1.8 of a fox. Real populations are counted in whole animals, and a run of bad luck when numbers are low can wipe one out.
- Other species. Real foxes also eat voles, mice, birds, insects and fruit, and rabbits are also eaten by buzzards, stoats and cats. A fox with other food to fall back on does not starve when rabbits are scarce, which damps the cycle.
- Seasons and ages. Rabbits breed mostly in spring and summer, and young animals cannot breed at once. The model lets every animal breed at the same steady rate all year round.
- Space. The meadow is treated as one well-mixed place. Real animals live in territories, and prey can hide in burrows, hedges and the next field.
- One start. The size of the loop depends on where it starts. Begin closer to the balance point and the cycle is gentler; start at the balance point and nothing changes at all.