A rule and its picture
A function is a rule that takes a number in and gives exactly one number out. Double it and add one. Square it. Take the height of a thrown ball after x seconds. The number going in is usually called x and the one coming out y, and the rule is written y = f(x).
Its graph is every pair (x, y) that obeys the rule, drawn as a point on a grid. Plot enough of them and they join into a line or a curve, and the whole rule becomes a single shape you can take in at a glance: where it rises, where it falls, where it is largest and where it crosses zero. Because each x gives one y, a graph never has two points straight above one another.
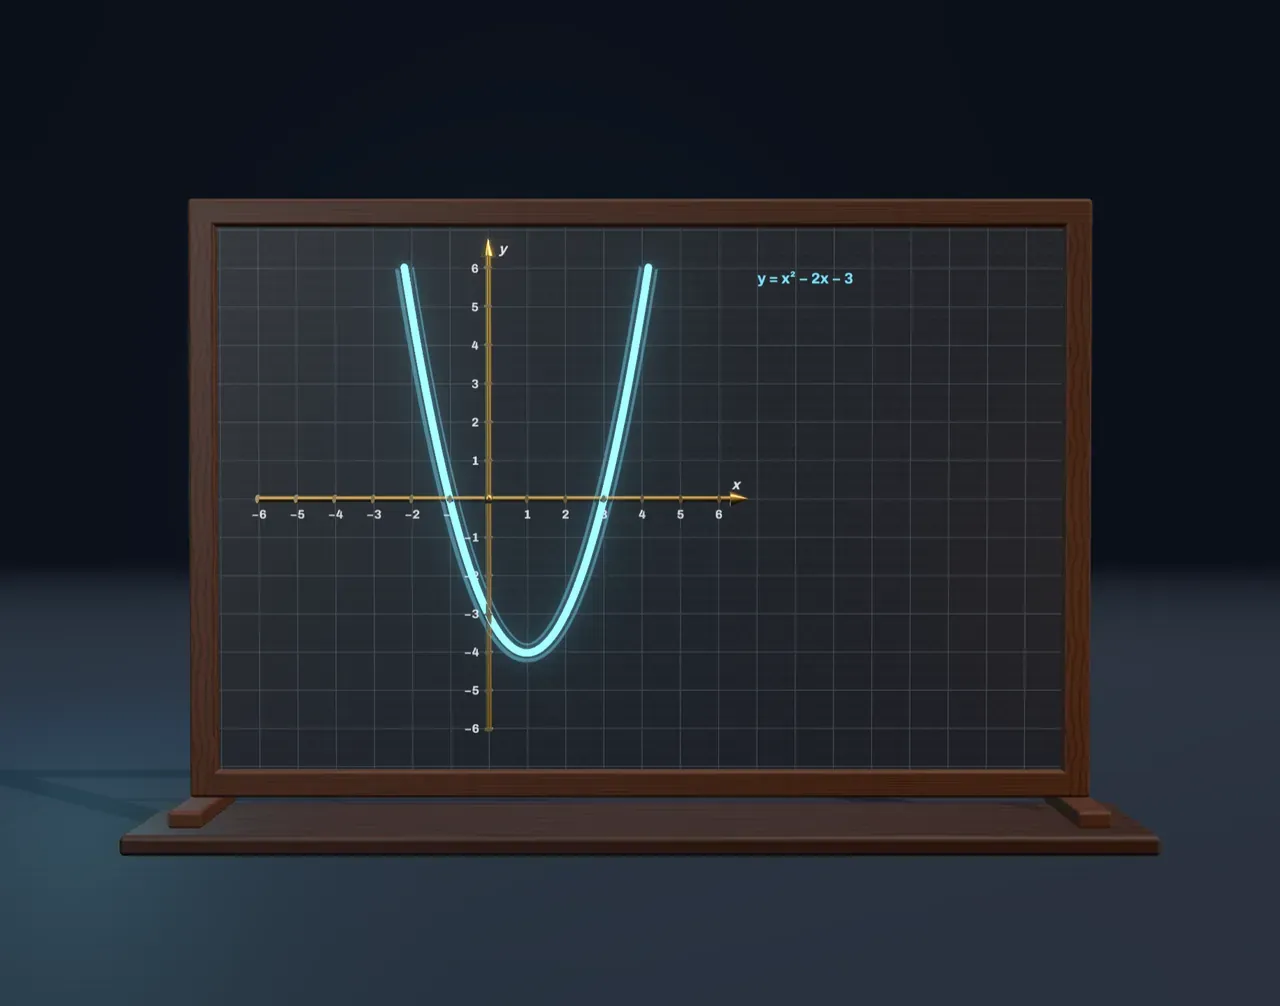
The board shows one of the most useful families, the quadratic functions, y = ax² + bx + c. Their graphs are parabolas, the same curve a jet from a fountain or a thrown ball traces, and the same one you get by slicing a cone parallel to its side.
What a, b and c each do
a sets the shape. When a is positive the arms point up and the curve has a lowest point; when it is negative they point down and the curve has a highest point. The larger a is, ignoring its sign, the narrower the curve; near zero it flattens out. At exactly zero the x² term is gone and the graph is a straight line, a linear function.
c lifts the whole curve up or down without changing its shape. It is the value of y at x = 0, so the curve always crosses the y-axis at the height c.
b is the odd one out. It neither stretches nor simply shifts the curve: it moves the lowest (or highest) point sideways and down (or up) at the same time. Slide b and that point travels along a second parabola, y = c − ax², the curve’s own upside-down twin through the point (0, c).
The vertex and the axis of symmetry
The turning point of a parabola is its vertex. Every parabola is symmetric about the upright line through its vertex, the axis of symmetry: fold the graph along that line and the two arms land on each other. The vertex sits at
x = −b / 2a,
and its height is the function’s value there. Rewriting the rule around that point gives the vertex form, y = a(x − h)² + k, with the vertex at (h, k). For the starting curve, y = x² − 2x − 3, the vertex is at (1, −4) and the curve is the plain parabola y = x² moved 1 to the right and 4 down.
Roots and the discriminant
The roots of the function are the values of x where y = 0: the places the curve meets the x-axis. The quadratic formula finds them,
x = (−b ± √(b² − 4ac)) / 2a,
and the number under the square root decides how many there are. It is the discriminant, written Δ = b² − 4ac.
- Δ > 0: two roots. The curve crosses the axis twice, at equal distances either side of the axis of symmetry.
- Δ = 0: one root. The vertex sits exactly on the x-axis and the curve just touches it.
- Δ < 0: no real roots. The square root of a negative number is not a real number, and on the board the whole curve stays above the axis or below it.
The discriminant is not a trick of the formula. It is the vertex’s height in disguise: Δ = −4a·k, where k is the height of the vertex. If the arms point up (a > 0), the curve reaches the axis only when the vertex is at or below it, and that is exactly when Δ ≥ 0. Pointing down, the vertex must be at or above it. One number checks which side of the axis the vertex is on, compared with the way the arms point.
Try it: keep a at 1 and b at −2, step Read the curve to Roots and Δ, then slide c to −3, then 1, then 3. The curve rises, the two roots close in and merge at the vertex, and Δ falls from 16 through 0 to −8.
Where the ideas came from
Problems that amount to solving a quadratic equation appear on Babylonian clay tablets almost 4,000 years old, worked as recipes with particular numbers. Around 820, the Baghdad scholar Muhammad ibn Musa al-Khwarizmi explained the method in general, completing a square with real squares and rectangles, in the book whose title gave us the word algebra. The idea of drawing an equation as a curve on a grid came much later, in the 1630s, from René Descartes and Pierre de Fermat, and the word function in its modern sense took shape over the following century, with Leibniz, Euler and others.
What this model leaves out
The board shows only quadratic functions, one family among many: functions can be built from powers, roots, sines, exponentials or any rule at all, and need not have a formula. It draws a fixed window from −6 to 6, so a far-off vertex or root is printed but not seen. The sliders move a, b and c in steps of a quarter or a half, and the printed values are rounded to two decimal places. When Δ is negative the equation still has two solutions among the complex numbers, which the board does not draw; Complex numbers is the place to meet them.