Light with gaps in it
Shine sunlight or a lamp filament’s light through a prism and it spreads into a smooth rainbow: every colour from red to violet, with no gaps. Hot solids and dense gases glow at every wavelength at once, as blackbody radiation describes.
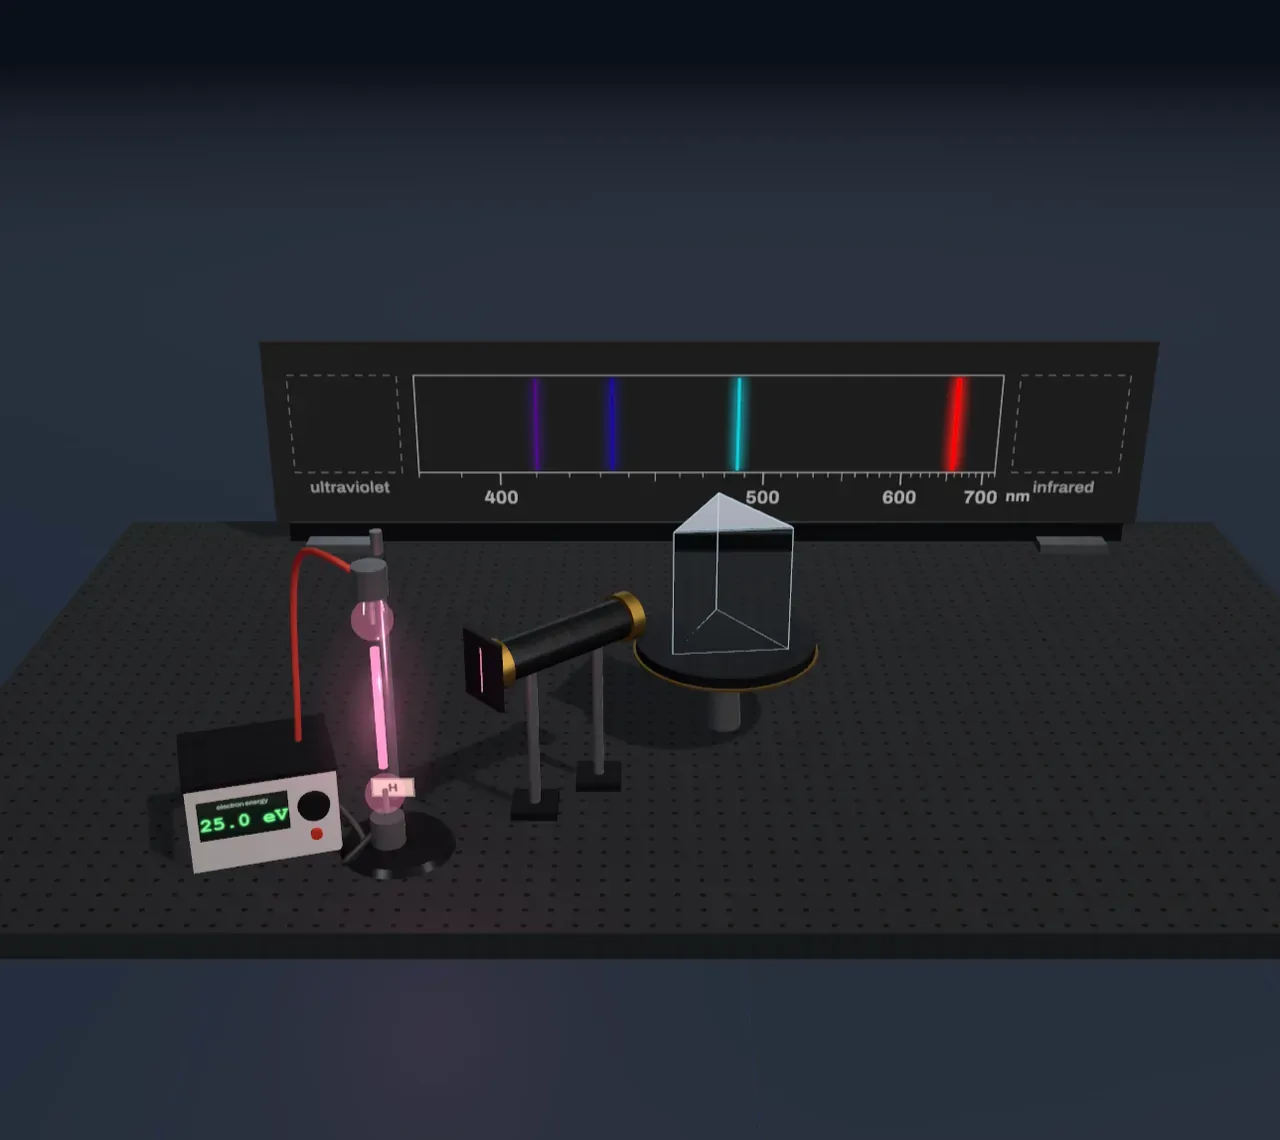
A thin gas is different. Fill a glass tube with hydrogen at low pressure, drive a current through it, and it glows a soft pink. Pass that pink light through a slit and a prism and there is no rainbow. Four thin lines land on the screen: a bright red one, a blue-green one and two faint violet ones, with darkness between them. That pattern of lines is hydrogen’s spectrum, and no other substance makes it.
In 1859 Gustav Kirchhoff and Robert Bunsen showed that each element has its own set of lines and that the set does not change, whether the element is in a flame, a spark or a star. Within two years they had found two new metals, caesium and rubidium, from lines no known element made. In 1868 astronomers saw a yellow line in the Sun’s light at 588 nanometres that matched nothing on Earth. They named the unknown element helium, after the Greek word for the Sun, and it was found on Earth 27 years later.
Only certain energies
The lines come from the way electrons sit in atoms. An electron bound to an atom cannot have just any energy. It can only be in one of a fixed set of states, called energy levels, like the rungs of a ladder with no places to stand between them. The lowest rung is the ground state, where an atom sits when it is left alone. The rungs above are excited states.
An excited atom does not stay excited for long, usually about a hundred-millionth of a second. Its electron drops to a lower level and the energy it loses leaves as one particle of light, a photon. Because the levels are fixed, the drop is fixed, and so is the photon’s energy. A photon’s energy sets its wavelength:
Here is Planck’s constant, the speed of light and an electronvolt (eV) is a convenient unit of energy for single atoms. A drop of 1.89 eV gives a photon of about 656 nanometres, red light. A bigger drop gives a shorter wavelength, towards blue and violet. A tube holds billions of billions of atoms making the same few drops, so the light piles up at those few wavelengths, and each one images the slit as a line.
Hydrogen’s four lines
Hydrogen has the simplest atom, one electron round one proton, and its ladder follows a simple rule. Measured from the ground state, level sits at
so level 2 is at 10.2 eV, level 3 at 12.09 eV and level 4 at 12.75 eV, and the rungs crowd together towards 13.6 eV, where the electron breaks free. Every visible line of hydrogen is a drop that ends on level 2: from 3 gives red, from 4 blue-green, from 5 and 6 violet. Johann Balmer found a formula for these wavelengths in 1885 without knowing why it worked; Niels Bohr explained it with energy levels in 1913.
Drops that end on level 1 are much bigger, at least 10.2 eV, and give ultraviolet light no eye can see. Drops that end on level 3 are small and give infrared. A spectroscope with the right detector finds both families, exactly where the ladder says.
Try it: keep Gas in the tube on Hydrogen and slide Show the energy jumps to Energy jumps. Beside the scene the ladder appears, and each jump down arrives as an arrow standing over the line it makes. The longer the arrow, the further its line sits towards violet. The last arrows land in the dark zones beyond the screen’s ends: ultraviolet and infrared.
Kicking atoms up
Something has to lift the atoms before they can fall. In a discharge tube that is the electrons of the current. The high voltage speeds them up between collisions, and when one hits an atom it can hand over energy, but only a whole step’s worth. An electron with too little energy for the first step just bounces off.
So the electrons’ energy decides which lines appear. The display on the supply shows it. Hydrogen needs 12.09 eV to reach level 3, so below that it gives no visible light at all. Between 12.09 and 12.75 eV, only the red line can appear. James Franck and Gustav Hertz showed this step-by-step energy transfer with mercury vapour in 1914, one of the first direct proofs that atoms have levels.
Try it: choose Hydrogen and set Electron energy to 12.5 eV. Only the red line shows, because 12.5 eV reaches level 3 but not level 4. Set it to 8 eV with Mercury and three lines appear, but the yellow one is missing until the energy passes 8.85 eV.
Above an element’s ionisation energy the electron is knocked out of the atom entirely. When the atom later recaptures an electron, it tumbles down through the levels and every line appears. A real tube’s electrons have a wide spread of energies, so in practice all the lines show at once.
Every element its own barcode
Each element has its own number of protons and electrons, so its levels sit at different energies and its lines fall in different places. Lithium’s red line is at 671 nanometres and hydrogen’s at 656: two reds a spectroscope tells apart easily. The pattern is a fingerprint.
Some patterns are familiar from street and shop lights. Sodium puts nearly all its visible light into one yellow line at 589 nanometres, the orange-yellow of old street lamps and of salt sprinkled into a flame. Neon’s many red and orange lines give neon signs their colour. Mercury’s strongest light is ultraviolet, at 254 nanometres; a fluorescent tube is a mercury lamp whose inner coating turns that invisible light into white.
Try it: set Electron energy to 25 eV and step through each Gas in the tube. Watch the tube’s colour change with its barcode: the pink of hydrogen is mostly its red line with some blue, and the blue-white of mercury is violet, blue and green together.
Dark lines: light taken away
The same levels work the other way. Shine white light through a cool gas and its atoms absorb photons that exactly match a jump up, and pass every other colour. The rainbow comes out with thin dark lines at the very wavelengths the gas would give out if it were hot. Cool atoms sit in their ground state, so they absorb only the jumps up from it: cool sodium vapour takes out its yellow line, while cool hydrogen absorbs only ultraviolet.
Sunlight is crossed by thousands of these dark lines, first mapped by Joseph von Fraunhofer in 1814. The gas in the Sun’s outer layers absorbs light from the hotter surface below, and the lines show which elements are there. This is how we know what stars are made of without visiting one. Glowing clouds of gas, like the red emission nebulae, shine in hydrogen’s red line. When a star or galaxy moves away from us, its whole barcode slides towards red by the Doppler effect, which is how the expansion of the universe was measured.
What this model leaves out
- The prism’s spread is exaggerated. A real flint prism spreads the visible spectrum over about 4 degrees. The scene widens the fan about seventeen times, as a spectroscope’s telescope magnifies it, but keeps its shape: blue and violet are spread more than red.
- The electrons all have one energy. In a real discharge they have a wide spread of energies, so a tube shows all its lines at once. The slider gives every electron exactly the displayed energy, to show the steps.
- The levels are simplified. Each element shows only its strongest lines and the levels they need. Sodium’s yellow line is really two lines 0.6 nanometres apart, and mercury’s yellow line is a pair too, drawn as one. The ultraviolet and infrared lines are parked in the zones beyond the strip, not placed to scale.
- Brightness is rough. Line strengths depend on the pressure, the current and the tube, and the scene’s brightnesses are a rough guide. Wavelengths are worked out from measured levels and are the values in vacuum, which are about 0.03 % longer than those in air.
- The gas is atoms. A real hydrogen tube holds hydrogen molecules, which the discharge splits apart; the molecules add a faint glow of their own that the scene leaves out. Sodium and lithium are metals and must be heated to a vapour first, as in a street lamp or a flame.
- Levels and arrows are a model. An energy ladder is a way of drawing the states an electron can be in, not a picture of where the electron is. The Atoms article shows the clouds that those states really look like, and Lasers shows what happens when a photon makes an excited atom fall.