Threatened, endangered, extinct
A species is extinct when its last member dies. Long before that, it can be threatened: likely to die out unless something changes. The International Union for Conservation of Nature (IUCN) keeps the Red List, which sorts the species it has assessed by how likely they are to vanish: least concern, near threatened, then the three threatened grades, vulnerable, endangered and critically endangered, and finally extinct in the wild and extinct. More than 40,000 species are on the threatened grades, over a quarter of all those assessed.
Species have always died out; the fossil record is full of them. What is unusual now is the rate, and the cause. The biggest threat by far is the loss of the places species live, as forests, grasslands and wetlands become farms, towns and roads. Hunting and overfishing, invasive species, pollution, disease and a changing climate follow.
All three species of orangutan, the great red apes of Borneo and Sumatra, are critically endangered. Borneo alone lost more than 100,000 of them between 1999 and 2015, mostly as lowland rainforest was logged, burned and replaced with oil palm plantations. Orangutans are especially easy to lose. A female has her first baby at about 15 and then one baby every seven or eight years, the longest wait between births of any mammal, so a population can grow by only a few per cent a year at best.
A forest cut into patches
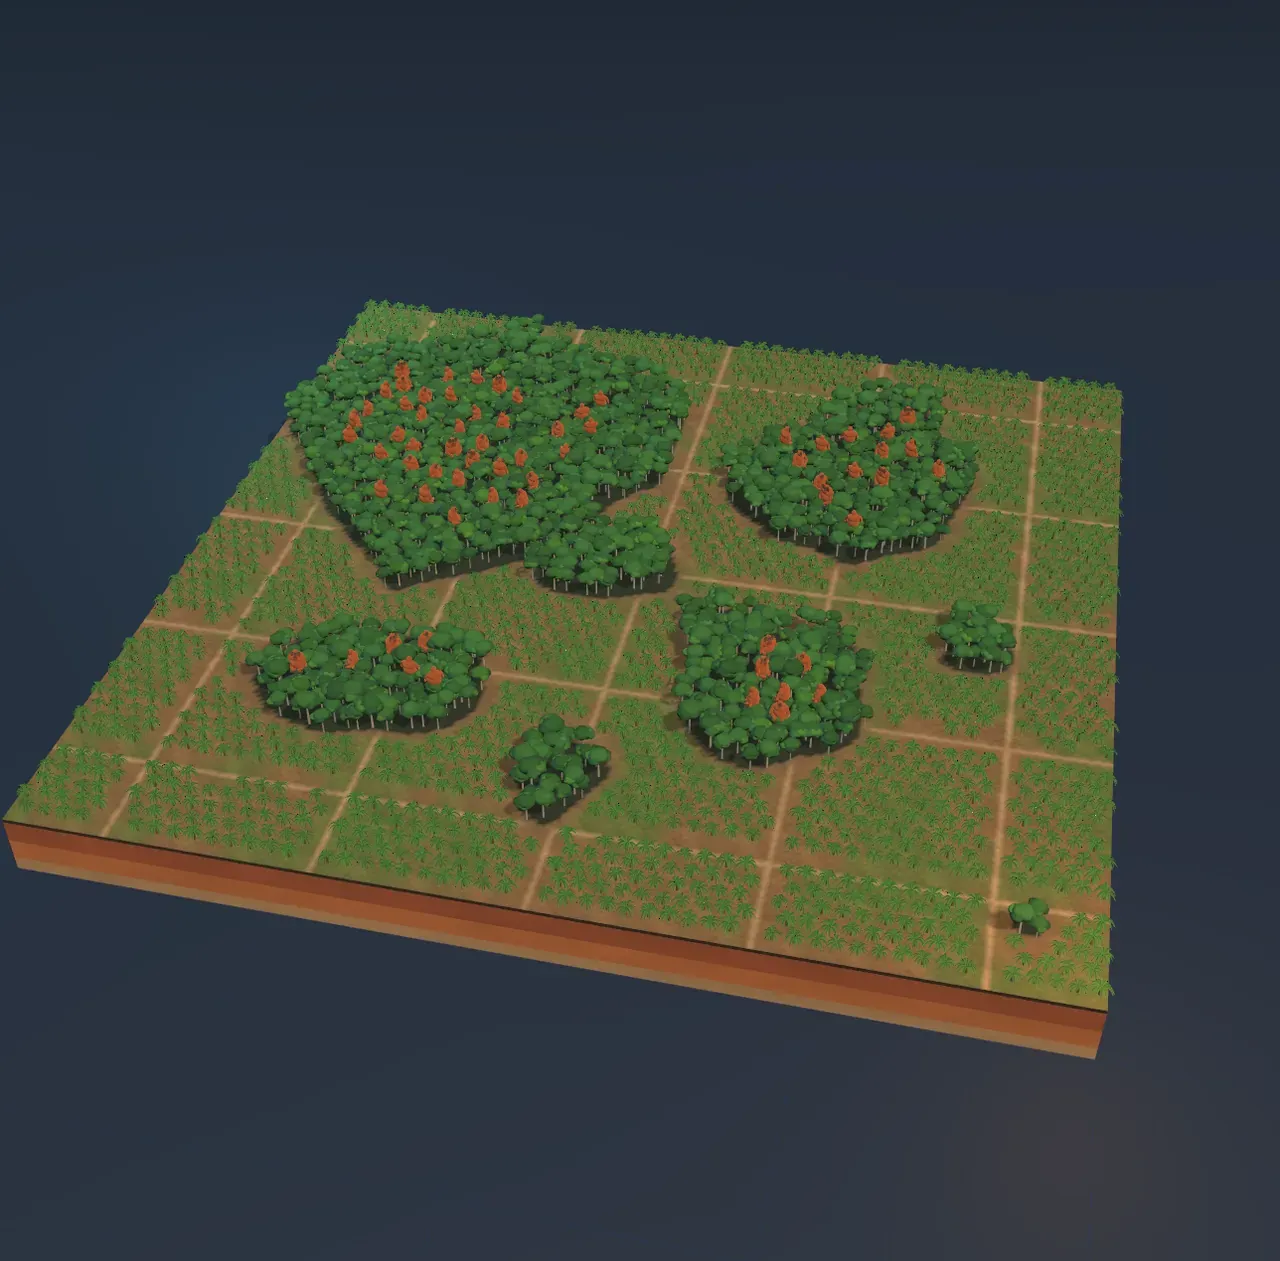
The Scene is 400 km² of rainforest, the kind of lowland forest described in Habitats and biomes. With Forest left at 100%, untouched, 200 orangutans live in it, about one for every 2 km², which is as many as the forest’s fruit can feed. Clearing the forest does two things at once. There is less of it, so it can feed fewer orangutans. And what is left is cut into separate patches, each with its own small group.
Try it: drag Forest left down slowly from 100%. At 60% the forest is smaller but still in one piece, with room for 118 orangutans. Below about half it breaks apart, and at 35%, mostly cleared, the 66 orangutans it can feed are split between four patches holding 39, 14, 7 and 6, with a few scraps of forest too small to feed even two.
Breaking up a habitat this way is called fragmentation. For a tree-living ape, the plantation between the patches is a desert. Orangutans can walk on the ground, but a young one crossing a plantation is easily lost, and may be killed. So each patch becomes an island, and each group has to survive on its own.
Why small groups die out
Drag Years from Year 0 to 100 years on with Forest left at 35%. In the typical run, the two smallest patches lose their orangutans for good, the one with 14 is down to two, and 21 of the 23 orangutans left are in the biggest patch. The forest in the empty patches is still standing. Nothing cut it down; the groups simply ran out of luck.
Four things make a small group fragile, and the model includes each of them:
- Chance. Every year some orangutans die and a few are born. In a group of 200 the good and bad luck evens out. In a group of six, three deaths in a row, or a run of sons and no daughters, can end it.
- Finding a mate. A patch whose last female dies, or whose last male does, can have no more young, however healthy the survivors are.
- Inbreeding. In a small, cut-off group, everyone is soon related to everyone else. Parents who are close relatives have more young with harmful inherited conditions, and fewer of their young survive. The group also loses the variety of genes that lets a species adapt, the raw material of natural selection. The model takes a share of the births of any group smaller than 50 to stand for this.
- Bad years. About one year in ten in the model is a drought-and-fire year, of the kind El Niño brings to Borneo, when more orangutans die and fewer are born. A bad year hits every patch at once, so the groups cannot cover for each other.
These feed on each other. A group shrunk by a bad year is more inbred, raises fewer young, and is more at the mercy of chance, so it shrinks further. Conservation biologists call this spiral the extinction vortex. Even the biggest patch dwindles in the model: some of its young set off across the plantation and never arrive, and its smaller group raises fewer young than the whole forest did.
Extinction risk is a chance
The Scene shows one possible century. Set Luck to Unlucky and the same 66 orangutans dwindle to 7; set it to Lucky and 44 are left. Which one happens cannot be known in advance, so the useful question is not “will they survive?” but “how likely are they to?”
That is what the charts answer. The model is run 200 times, each run with its own chance births, deaths and bad years. The upper chart draws the run the Scene shows over the band that eight runs in ten fall within. The lower chart counts the runs in which no orangutans at all are left: that share is the extinction risk. Working it out for a real population, from its numbers, birth and death rates and threats, is called a population viability analysis, and it is how conservationists decide which populations are in most danger.
Try it: slide Forest left down to 15%, mere scraps. Only 27 orangutans fit in the three patches left, and in about one run in six none are left after 100 years. At 10% it is nearly one run in three.
At 35%, all the orangutans are lost in only one or two runs in 200 within the century. That is not the same as safe. Most runs end with fewer than 30 orangutans, and a group that small, cut off, faces the same odds all over again in the century after. A rough rule of thumb from the 1980s says that about 50 animals are needed to avoid the worst of inbreeding in the short term, and about 500 to keep enough variety of genes to adapt in the long run.
What helps them recover
The first answer is the most obvious one: keep the forest, and grow more of it. Every step of Forest left is room for more orangutans, and a bigger population is the best protection there is against bad luck. Protecting the orangutans themselves from hunting and from being killed on farms matters too.
The second answer is to join the patches back up.
Try it: with Forest left at 35%, switch Wildlife corridors on and drag Years to the end. Strips of planted forest now link the four patches. The typical run keeps 55 of its 66 orangutans, and all four patches still hold some.
A wildlife corridor is a strip of habitat that animals can travel along between patches. It helps in three ways. Young orangutans looking for a home can reach a patch with room for them instead of dying in the plantation. If a patch does lose its orangutans, newcomers can settle it again. And travellers carry new genes into each group, so the patches behave like one big population rather than four small ones. In the model, the smallest patch, on its own, ends the century empty in three runs out of four; joined to the others, it almost never does. Even at 15%, corridors cut the chance of losing every orangutan from about one in six to about one in twenty.
Real corridors take many forms. Along the Kinabatangan River in Sabah, on Borneo, conservation groups are replanting riverside forest to reconnect patches cut off by plantations, and orangutans use rope bridges strung across the river’s tributaries. In Banff National Park in Canada, bridges and tunnels over and under the Trans-Canada Highway are used by bears, wolves, elk and deer.
Recovery does happen. The Iberian lynx fell to fewer than 100 animals in 2002; protecting its habitat, breeding it in captivity, releasing it into new areas and restoring its prey brought it to more than 2,000, and in 2024 it moved from endangered to vulnerable. Mountain gorillas, protected from poaching, have grown to more than 1,000 and moved down a grade in 2018. In 1987 the last 27 California condors were taken into captivity; there are now more than 500, over half of them flying free. Each of these recoveries took decades of work, and each started by making a small population bigger and safer.
A threatened species is never alone in its trouble. Orangutans spread the seeds of the fruit they eat, so they help their forest regrow, and the animals that share their forest are in the same patches. How the populations of a place rise and fall together is the subject of Ecosystems and population dynamics, and who depends on whom for food is that of Food chains.
What this model leaves out
- Real lives. The model’s orangutans have no ages: any female can give birth in any year, at a rate set to match the slow breeding of real ones on average. Real females breed only from about 15, and males and females use the forest differently.
- The numbers. The death rate, birth rate, inbreeding cost, frequency of bad years and chances of crossing a plantation are round numbers chosen to behave plausibly, not measured for a real forest. The shapes of the results (smaller groups vanish first, joined groups last longest) are more trustworthy than the exact percentages.
- The forest itself. Every hectare of forest feeds the same number of orangutans. Real patches are worse near their edges, where they dry out and burn more easily, and logged forest feeds fewer than untouched forest.
- People. Hunting, killing in conflicts with farmers, the pet trade, new clearing and disease are left out, and in real forests they matter a great deal. So do the people who protect forests, rescue orangutans and return them to the wild.
- Corridors. The model’s corridors appear fully grown in year 0, and every traveller along one arrives. Real corridors take decades to grow and need to be wide and leafy enough for animals to use.
- One century. The charts stop at 100 years. A population that survives the century in a small patch faces the same risks in the next.